

Question: Here are comparative statement data for Ivanhoe Company and Pharoah Company, two competitors. All balance sheet data are as of December 31, 2022, and December
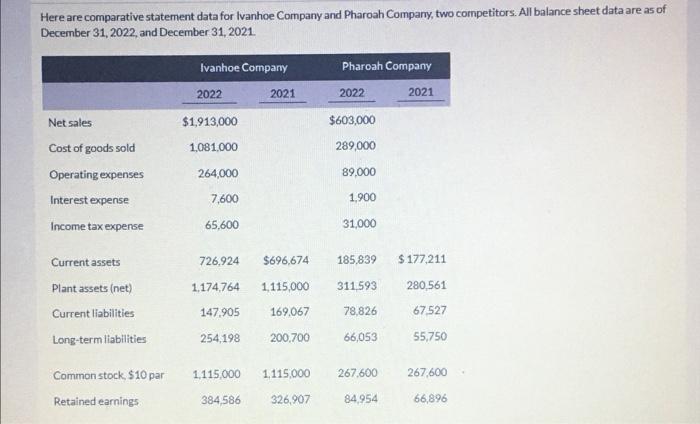
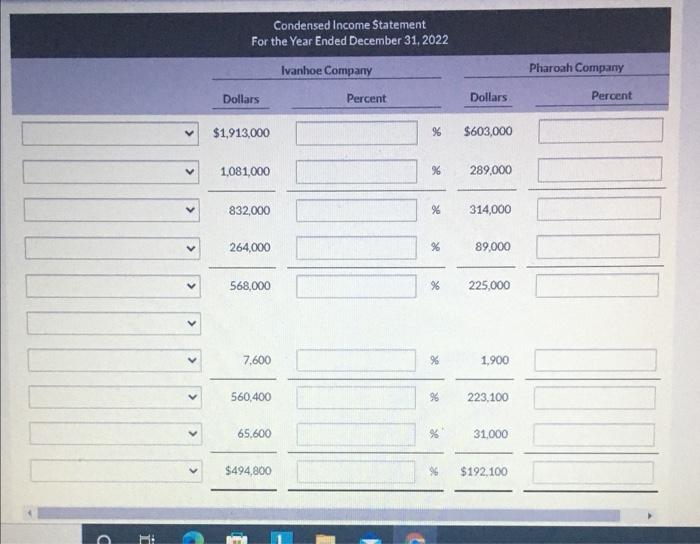
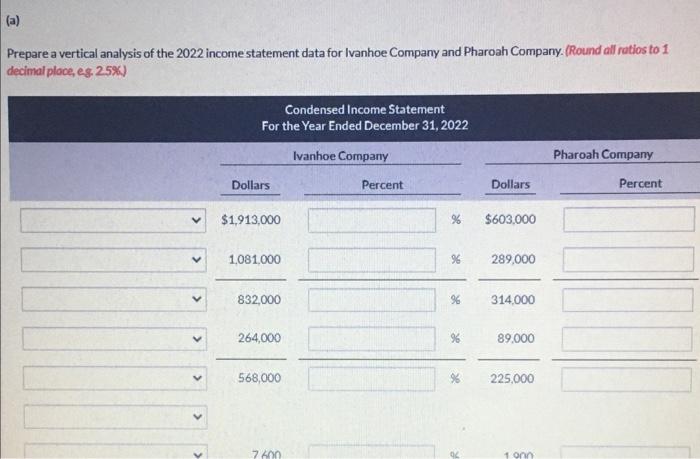
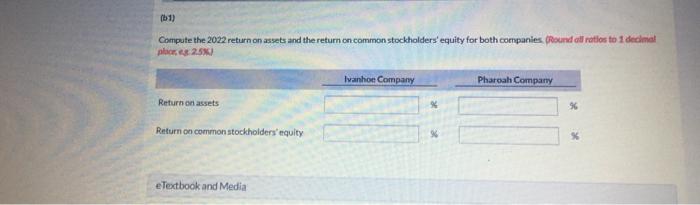
Here are comparative statement data for Ivanhoe Company and Pharoah Company, two competitors. All balance sheet data are as of December 31, 2022, and December 31, 2021. Ivanhoe Company 2022 2021 $1,913,000 1,081,000 264,000 Pharoah Company 2022 2021 $603,000 Net sales 289,000 89,000 Cost of goods sold Operating expenses Interest expense Income tax expense 7,600 1.900 65,600 31,000 726,924 $696,674 185.839 $ 177.211 1.174,764 1115,000 311,593 280,561 Current assets Plant assets (net) Current liabilities Long-term liabilities 147.905 169.067 78,826 67.527 254,198 200,700 66,053 55,750 1.115,000 1.115.000 267.600 267,600 Common stock, $10 par Retained earnings 384,586 326,907 84.954 66,896 Condensed Income Statement For the Year Ended December 31, 2022 Ivanhoe Company Pharoah Company Dollars Percent Dollars Percent $1,913,000 $603,000 V 1,081,000 96 289,000 832,000 % 314,000
Step by Step Solution
There are 3 Steps involved in it

Get step-by-step solutions from verified subject matter experts