

Question: Here are comparative statement data for Ivanhoe Company and Pharoah Company, two competitors. All balance sheet data are as of December 31, 2022, and December
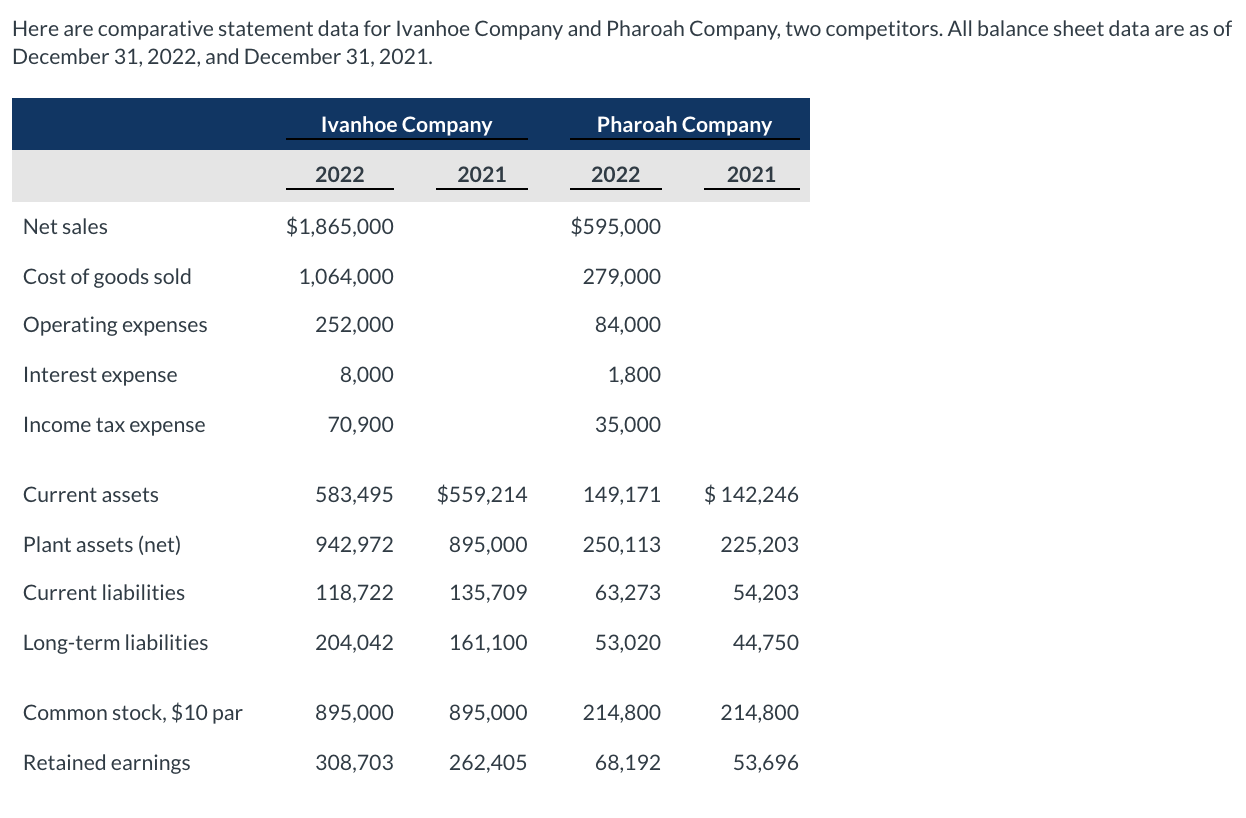
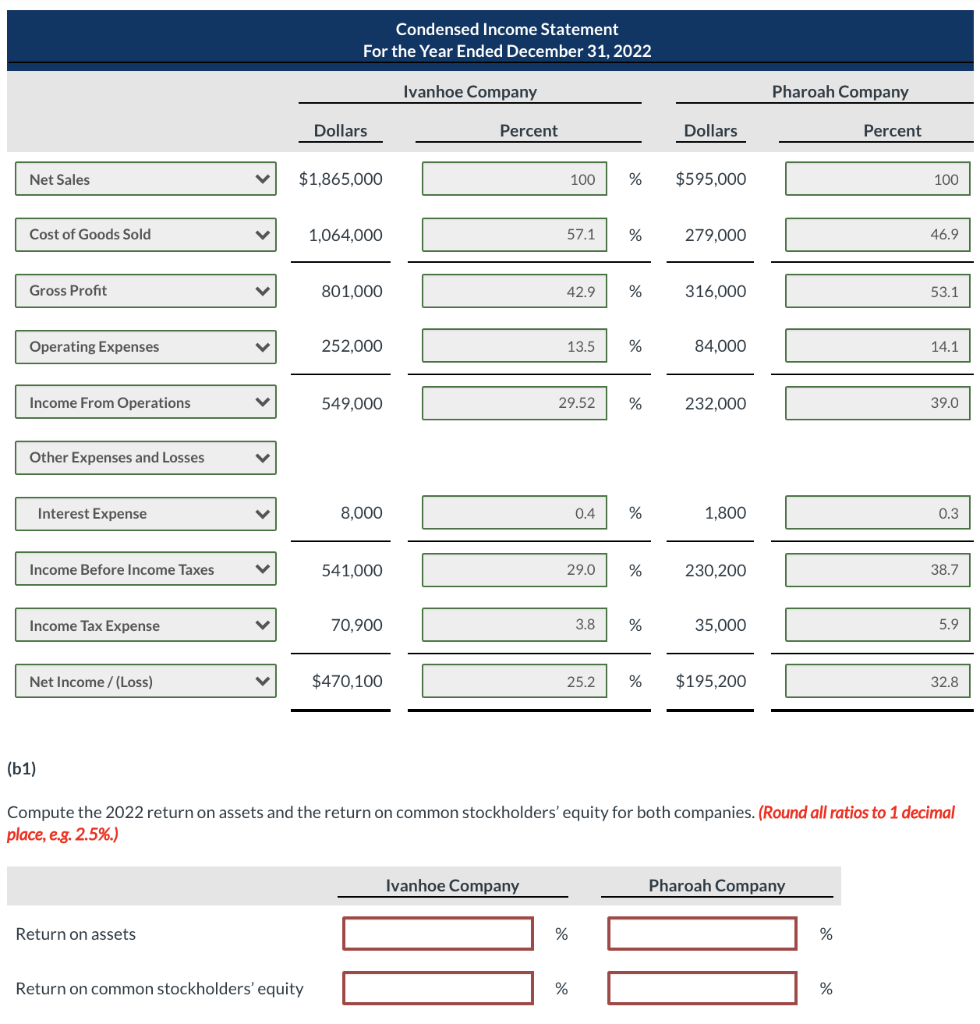
Here are comparative statement data for Ivanhoe Company and Pharoah Company, two competitors. All balance sheet data are as of December 31, 2022, and December 31, 2021. Ivanhoe Company Pharoah Company 2022 2021 2022 2021 Net sales $1,865,000 $595,000 Cost of goods sold 1,064,000 279,000 Operating expenses 252,000 84,000 Interest expense 8,000 1,800 Income tax expense 70,900 35,000 Current assets 583,495 $559,214 149,171 $ 142,246 Plant assets (net) 942,972 895,000 250,113 225,203 Current liabilities 118,722 135,709 63,273 54,203 Long-term liabilities 204,042 161,100 53,020 44,750 Common stock, $10 par 895,000 895,000 214,800 214,800 Retained earnings 308,703 262,405 68,192 53,696 Condensed Income Statement For the Year Ended December 31, 2022 Ivanhoe Company Pharoah Company Dollars Percent Dollars Percent Net Sales $1,865,000 100 % $595,000 100 Cost of Goods Sold 1,064,000 57.1 % 279,000 46.9 Gross Profit 801,000 42.9 % 316,000 53.1 Operating Expenses 252,000 13.5 % 84.000 14.1 Income From Operations 549,000 29.52 % 232,000 39.0 Other Expenses and Losses Interest Expense 8,000 0.4 % 1,800 0.3 Income Before Income Taxes V 541,000 29.0 % 230,200 38.7 Income Tax Expense 70,900 3.8 % 35,000 5.9 Net Income /(Loss) V $470,100 25.2 % $195,200 32.8 (61) Compute the 2022 return on assets and the return on common stockholders' equity for both companies. (Round all ratios to 1 decimal place, e.g. 2.5%.) Ivanhoe Company Pharoah Company Return on assets % % Return on common stockholders' equity % %
Step by Step Solution
There are 3 Steps involved in it

Get step-by-step solutions from verified subject matter experts