

Question: Here are comparative statement data for Ivanhoe Company and Pharoah Company, two competitors. All balance sheet data are as of December 31, 2022, and December
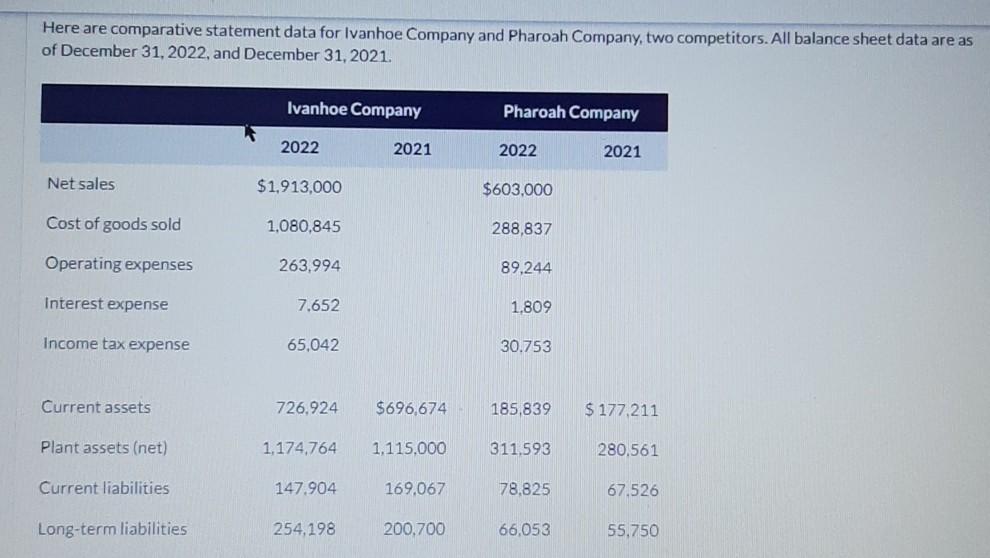
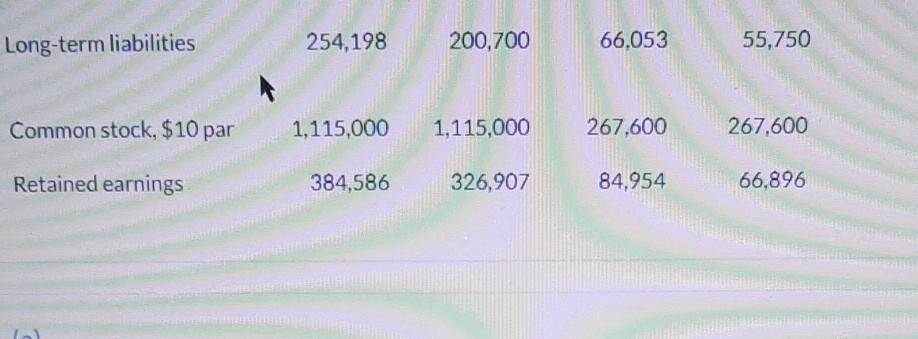
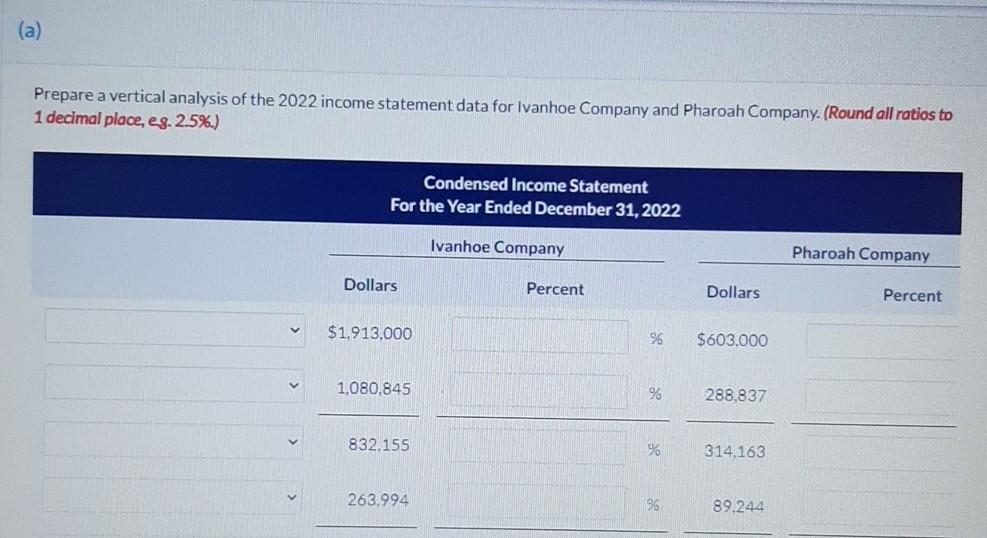
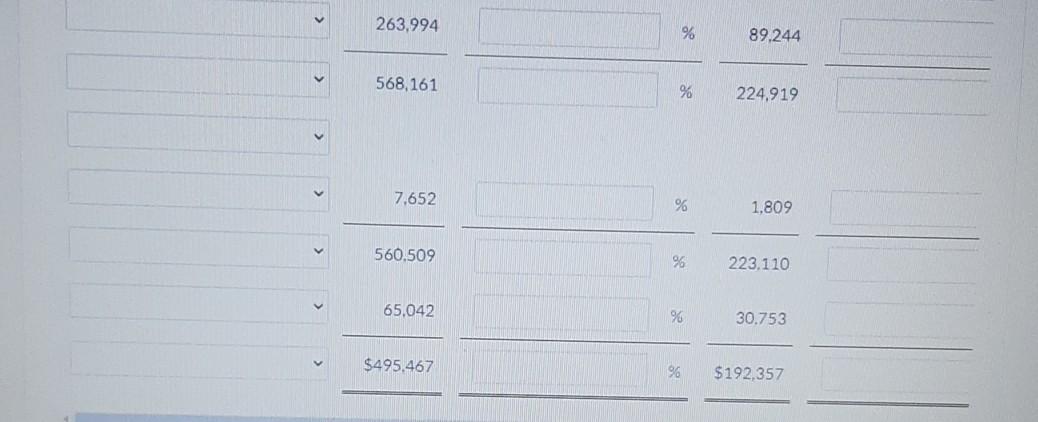
Here are comparative statement data for Ivanhoe Company and Pharoah Company, two competitors. All balance sheet data are as of December 31, 2022, and December 31, 2021. Ivanhoe Company Pharoah Company 2022 2021 2022 2021 Net sales $1,913,000 $603.000 Cost of goods sold 1,080,845 288,837 Operating expenses 263,994 89,244 Interest expense 7,652 1.809 Income tax expense 65,042 30.753 Current assets 726,924 $696,674 185,839 $ 177.211 Plant assets (net) 1,174,764 1,115,000 311,593 280,561 Current liabilities 147.904 169,067 78,825 67.526 Long-term liabilities 254,198 200,700 66,053 55,750 (a) Prepare a vertical analysis of the 2022 income statement data for Ivanhoe Company and Pharoah Company. (Round all ratios to 1 decimal place, eg. 2.5%.) Condensed Income Statement For the Year Ended December 31, 2022 Ivanhoe Company Pharoah Company Dollars Percent Dollars Percent . $1.913.000 96 $603.000 1,080,845 % 288,837 832.155 96 314.163 263.994 96 89.244 263,994 % 89,244 568,161 % 224,919 7,652 % 1.809 560,509 96 223.110 65,042 96 30.753 $495.467 96 $192,357
Step by Step Solution
There are 3 Steps involved in it

Get step-by-step solutions from verified subject matter experts