

Question: Here is a 2x2 contingency table for two dichotomous categorical variables. The first variable indicates geographic region, where 0 indicates the northern region and 1
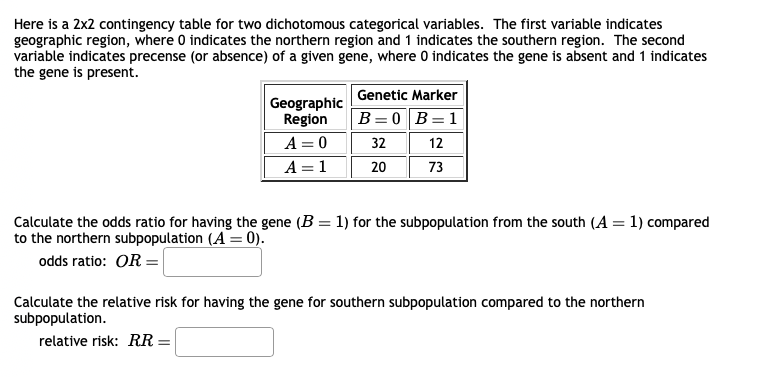
Here is a 2x2 contingency table for two dichotomous categorical variables. The first variable indicates geographic region, where 0 indicates the northern region and 1 indicates the southern region. The second variable indicates precense (or absence) of a given gene, where 0 indicates the gene is absent and 1 indicates the gene is present. Geographic Genetic Marker Region B =0 B =1 A =0 32 12 A =1 20 73 Calculate the odds ratio for having the gene (B = 1) for the subpopulation from the south (A = 1) compared to the northern subpopulation (A = 0). odds ratio: OR = Calculate the relative risk for having the gene for southern subpopulation compared to the northern subpopulation. relative risk: R.R
Step by Step Solution
There are 3 Steps involved in it

Get step-by-step solutions from verified subject matter experts