

Question: Here is a sample data set (n = 48) that is nearly normal with two outliers (as can be seen in the histogram provided after
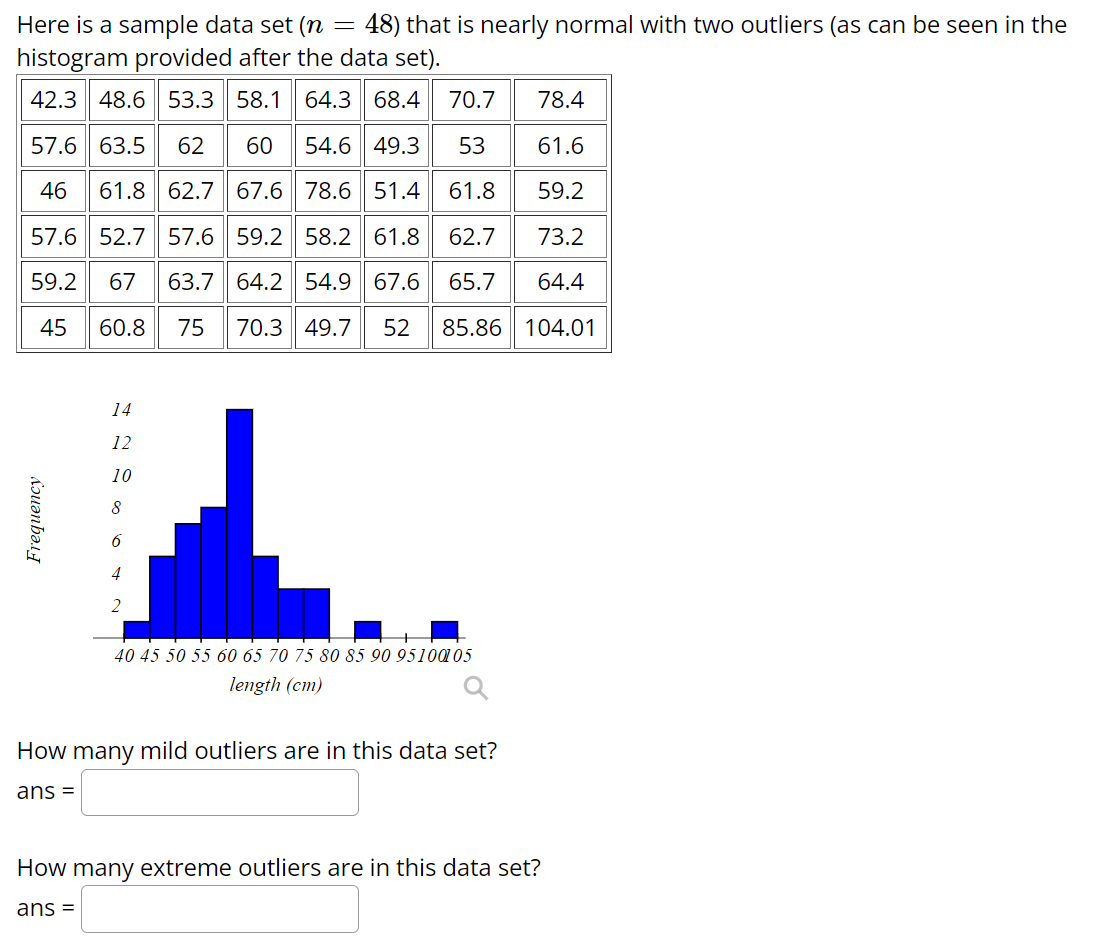
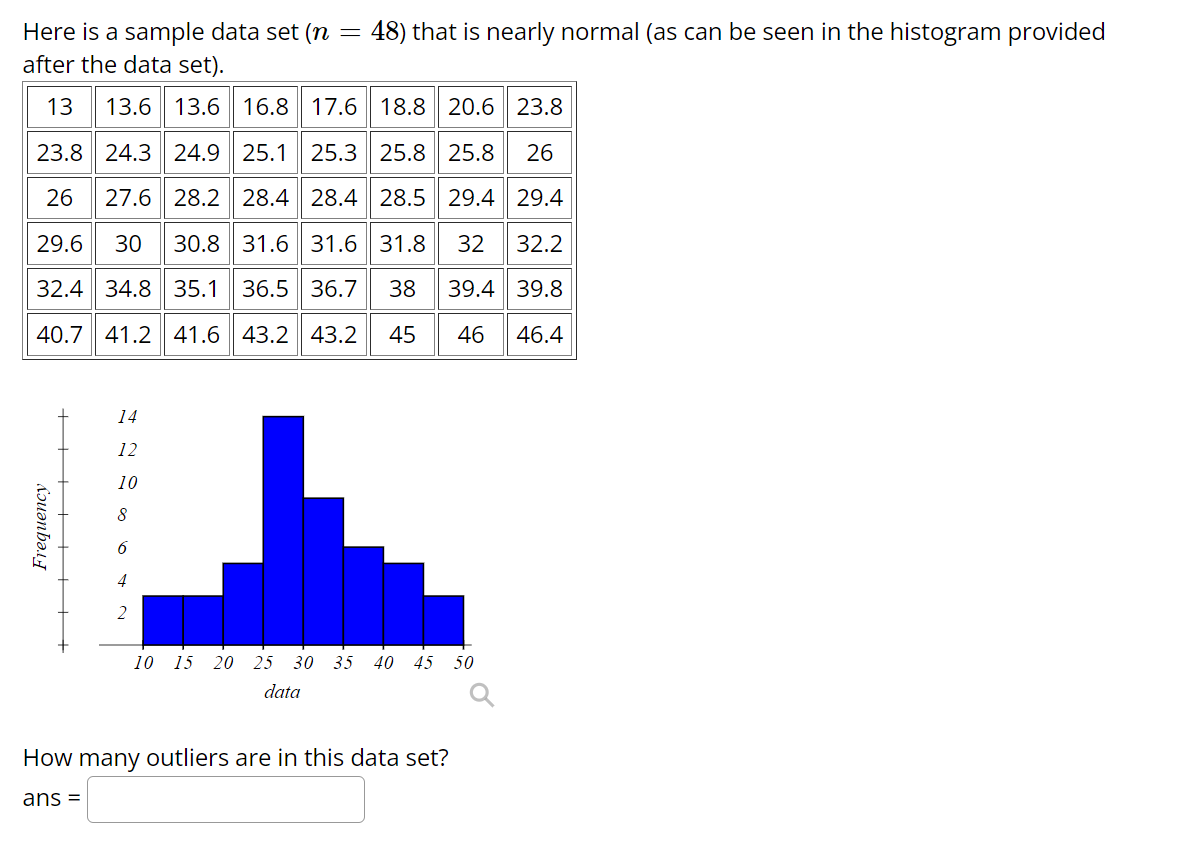
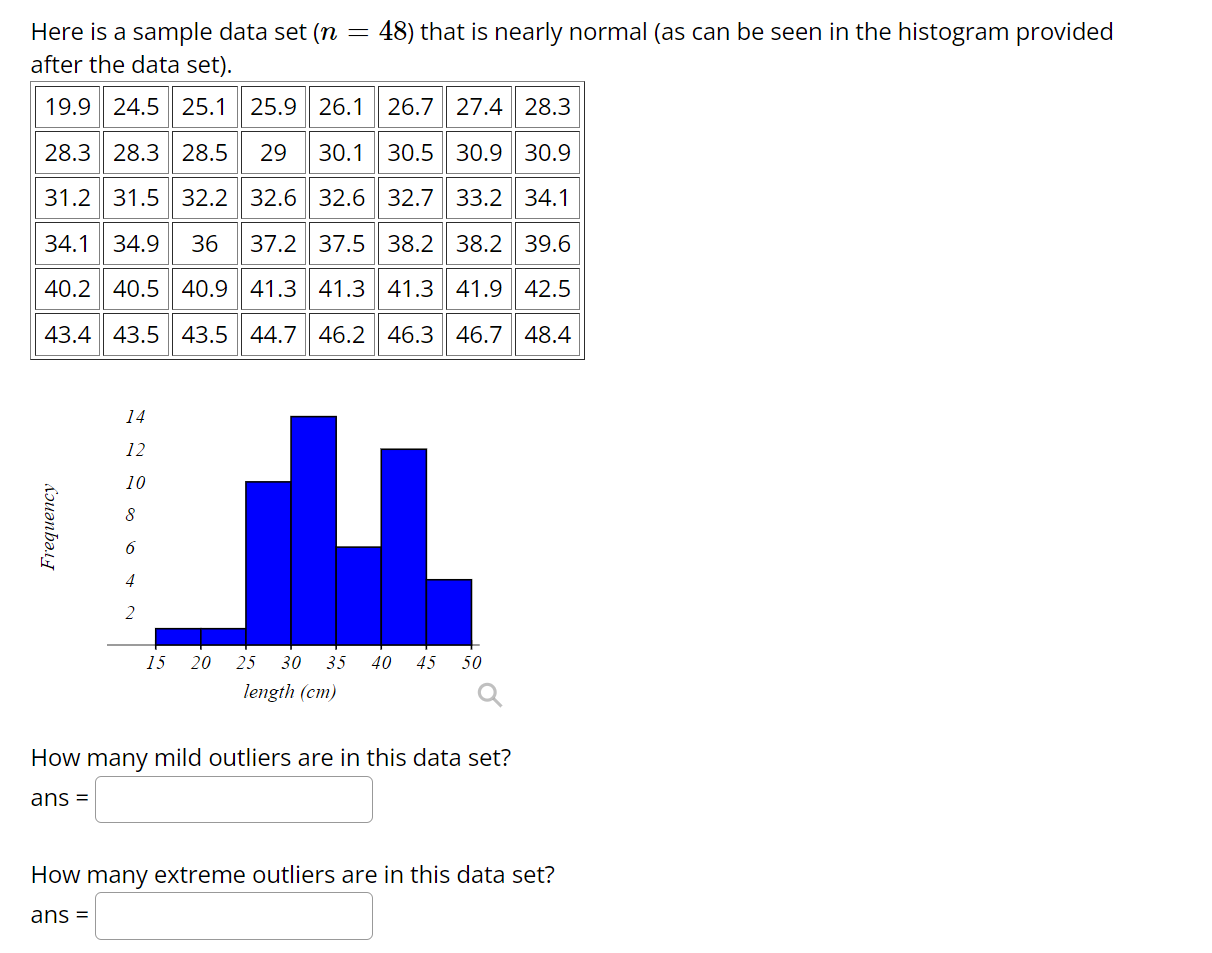
Here is a sample data set (n = 48) that is nearly normal with two outliers (as can be seen in the histogram provided after the data set). 42.3 48.6 53.3 58.1 64.3 68.4 70.7 78.4 57.6 63.5 62 60 54.6 49.3 53 61.6 46 61.8 62.7 67.6 78.6 51.4 61.8 59.2 57.6 52.7 57.6 59.2 58.2 61.8 62.7 73.2 59.2 67 63.7 64.2 54.9 67.6 65.7 64.4 45 60.8 75 70.3 49.7 52 85.86 104.01 14 12 10 Frequency 40 45 50 55 60 65 70 75 80 85 90 95100105 length (cm) Q How many mild outliers are in this data set? ans = How many extreme outliers are in this data set? ans =Here is a sample data set (n = 48) that is nearly normal (as can be seen in the histogram provided after the data set). 13 13.6 13.6 16.8 17.6 18.8 20.6 23.8 23.8 24.3 24.9 25.1 25.3 25.8 25.8 26 26 27.6 28.2 28.4 28.4 28.5 29.4 29.4 29.6 30 30.8 31.6 31.6 31.8 32 32.2 32.4 34.8 35.1 36.5 36.7 38 39.4 39.8 40.7 41.2 41.6 43.2 43.2 45 46 46.4 + 14 12 10 Frequency N + 10 15 20 25 30 35 40 45 50 data Q How many outliers are in this data set? ans =Here is a sample data set (11 : 48) that is nearly normal (as can be seen in the histogram provided after the data set). 19.9 24.5 25.1 25.9 26.1 26.7 27.4 28.3 28.3 28.3 28.5 29 30.1 30.5 30.9 30.9 31.2 31.5 32.2 32.6 32.6 32.7 33.2 34.1 34.1 34.9 36 37.2 37.5 38.2 38.2 39.6 40.2 40.5 40.9 41.3 41.3 41.3 41.9 42.5 43.4 43.5 43.5 44.7 46.2 46.3 46.7 48.4 F1 'eqirency 15 20 25 30 35 40 45 50 length (cm) How many mild outliers are in this data set? ans = How many extreme outliers are in this data set? ans =
Step by Step Solution
There are 3 Steps involved in it

Get step-by-step solutions from verified subject matter experts