

Question: What the data is saying? Provide updated data if possible to reflect todays figures and provide a brief description of a strategy that could be
What the data is saying? Provide updated data if possible to reflect todays figures and provide a brief description of a strategy that could be used. What are the strategic implications for each of the I/E Matrix, BCG Matrix, and the SPACE Matrix? I have provided all matrixs, so question is not incomplete. I wouldn't be asking it if it were as simple as copying and pasting, which I could do myself. Please read the question it is straight forward.
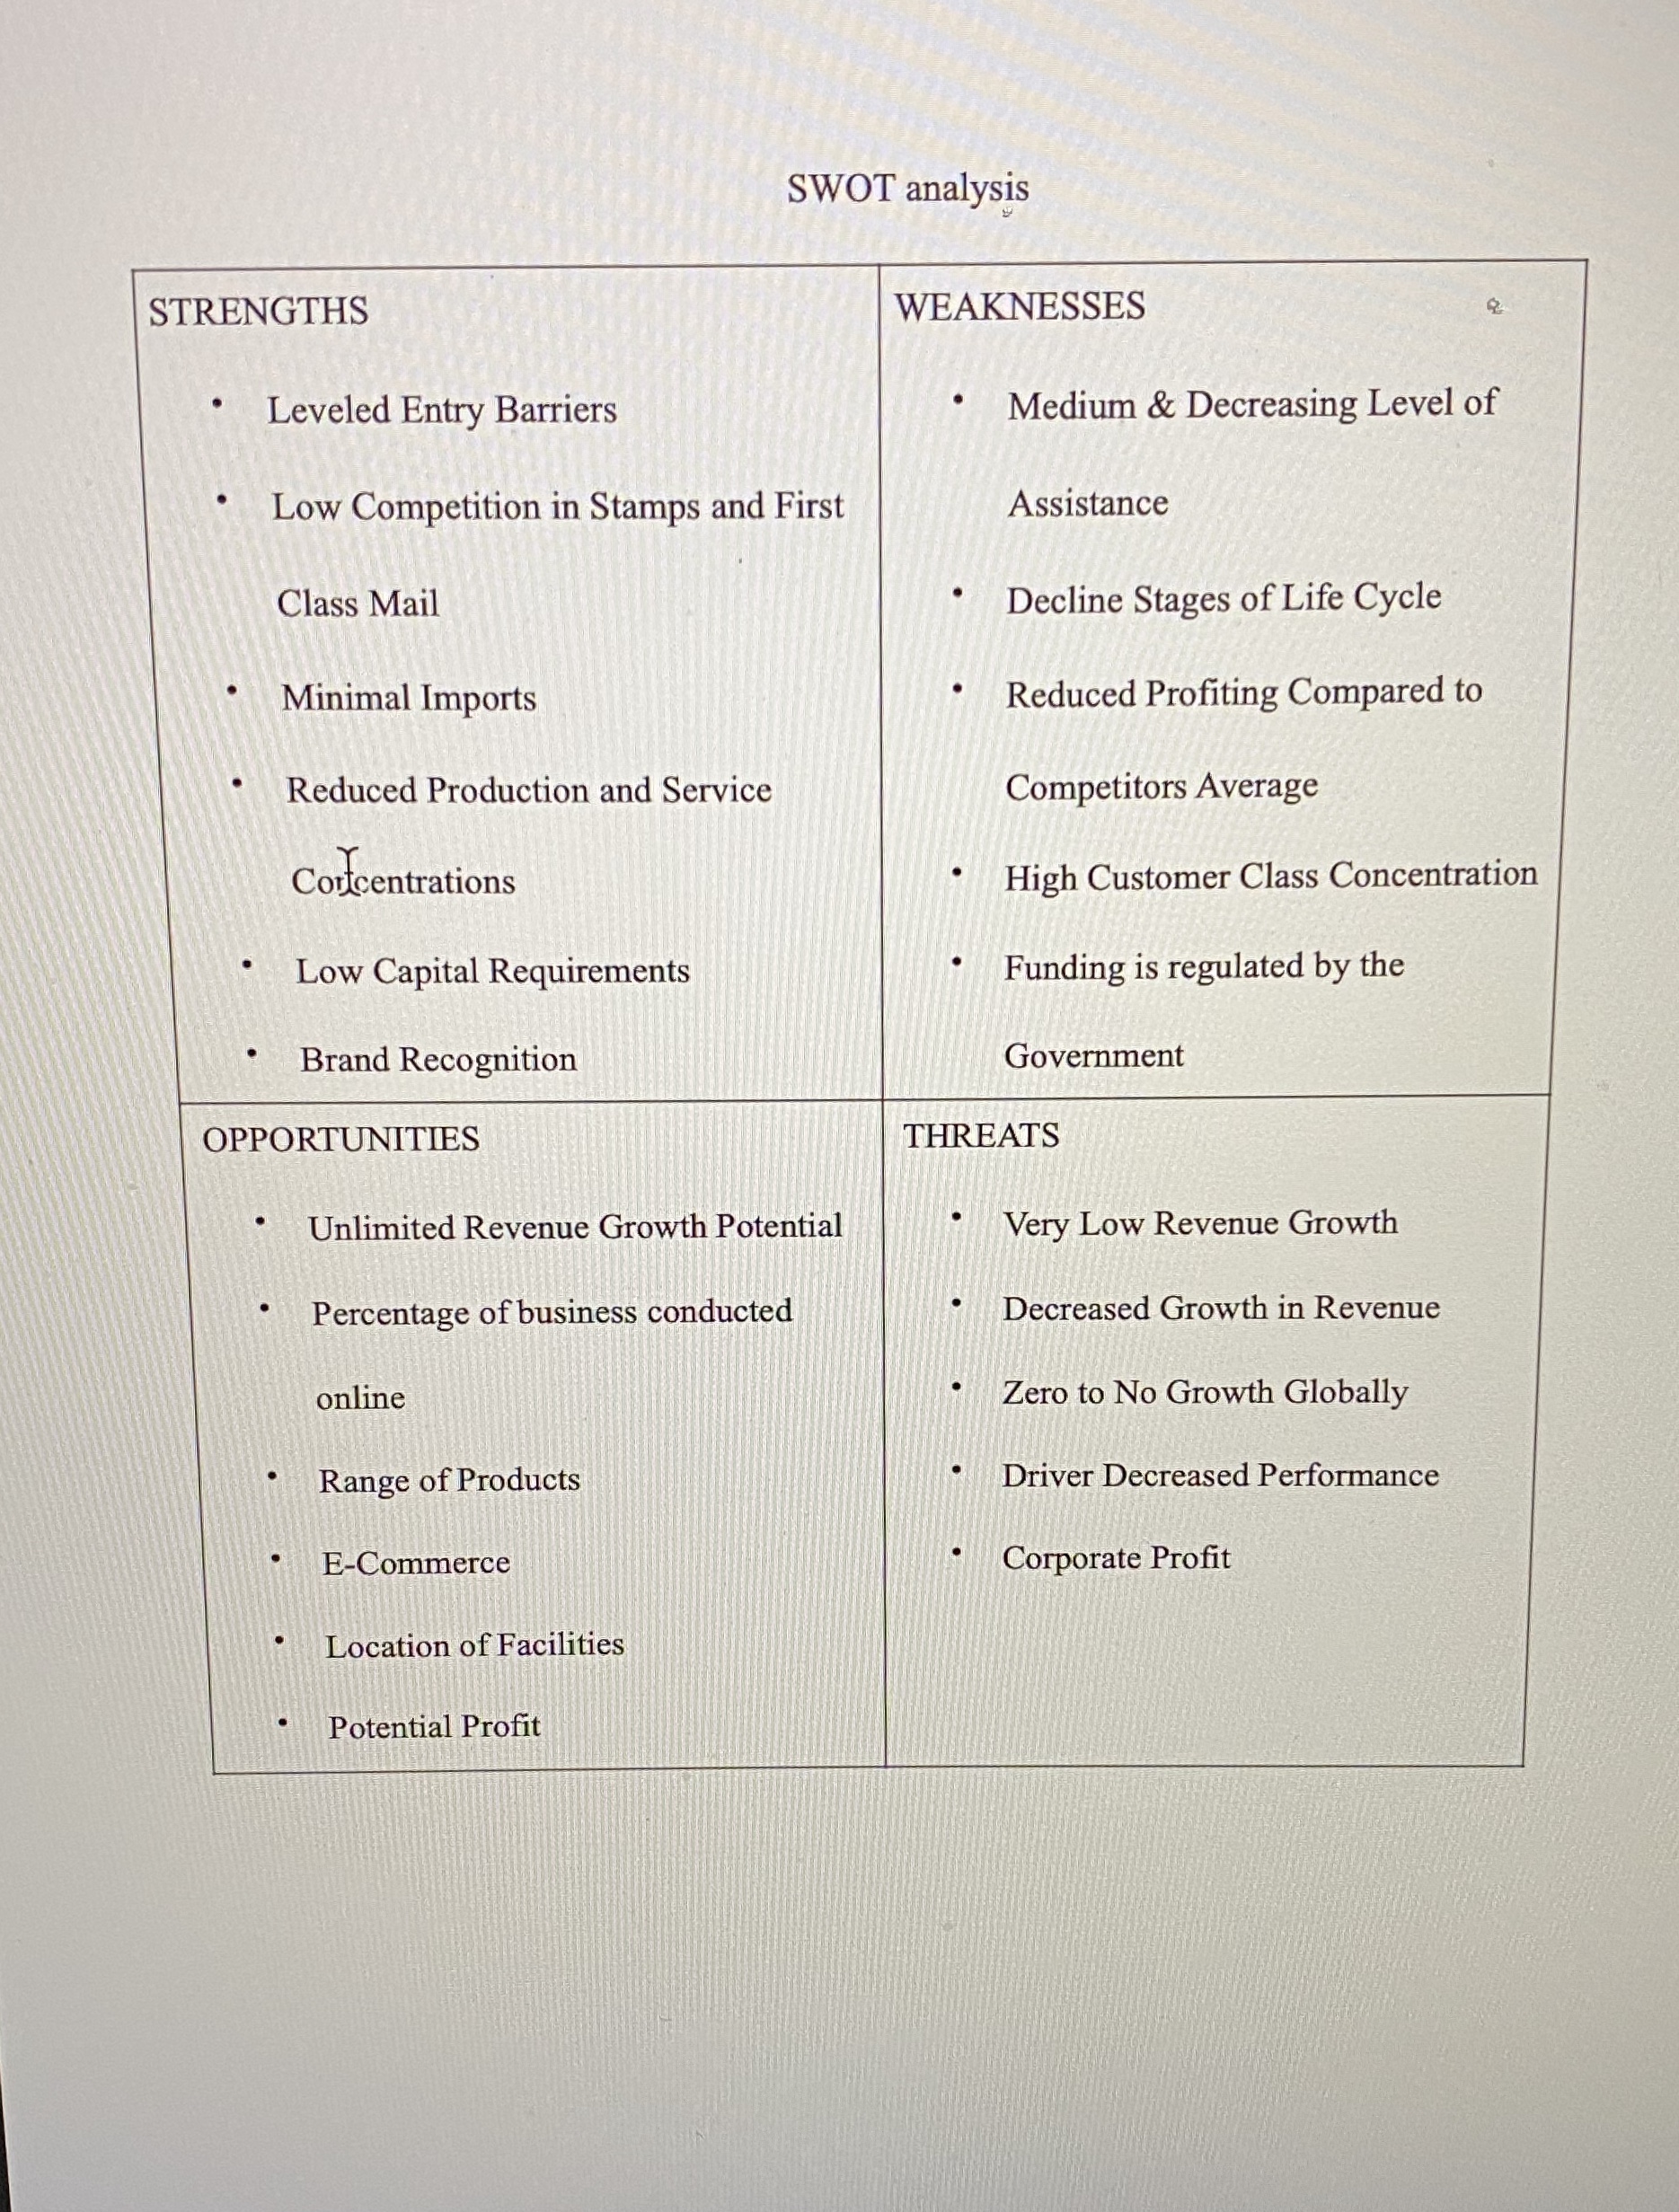
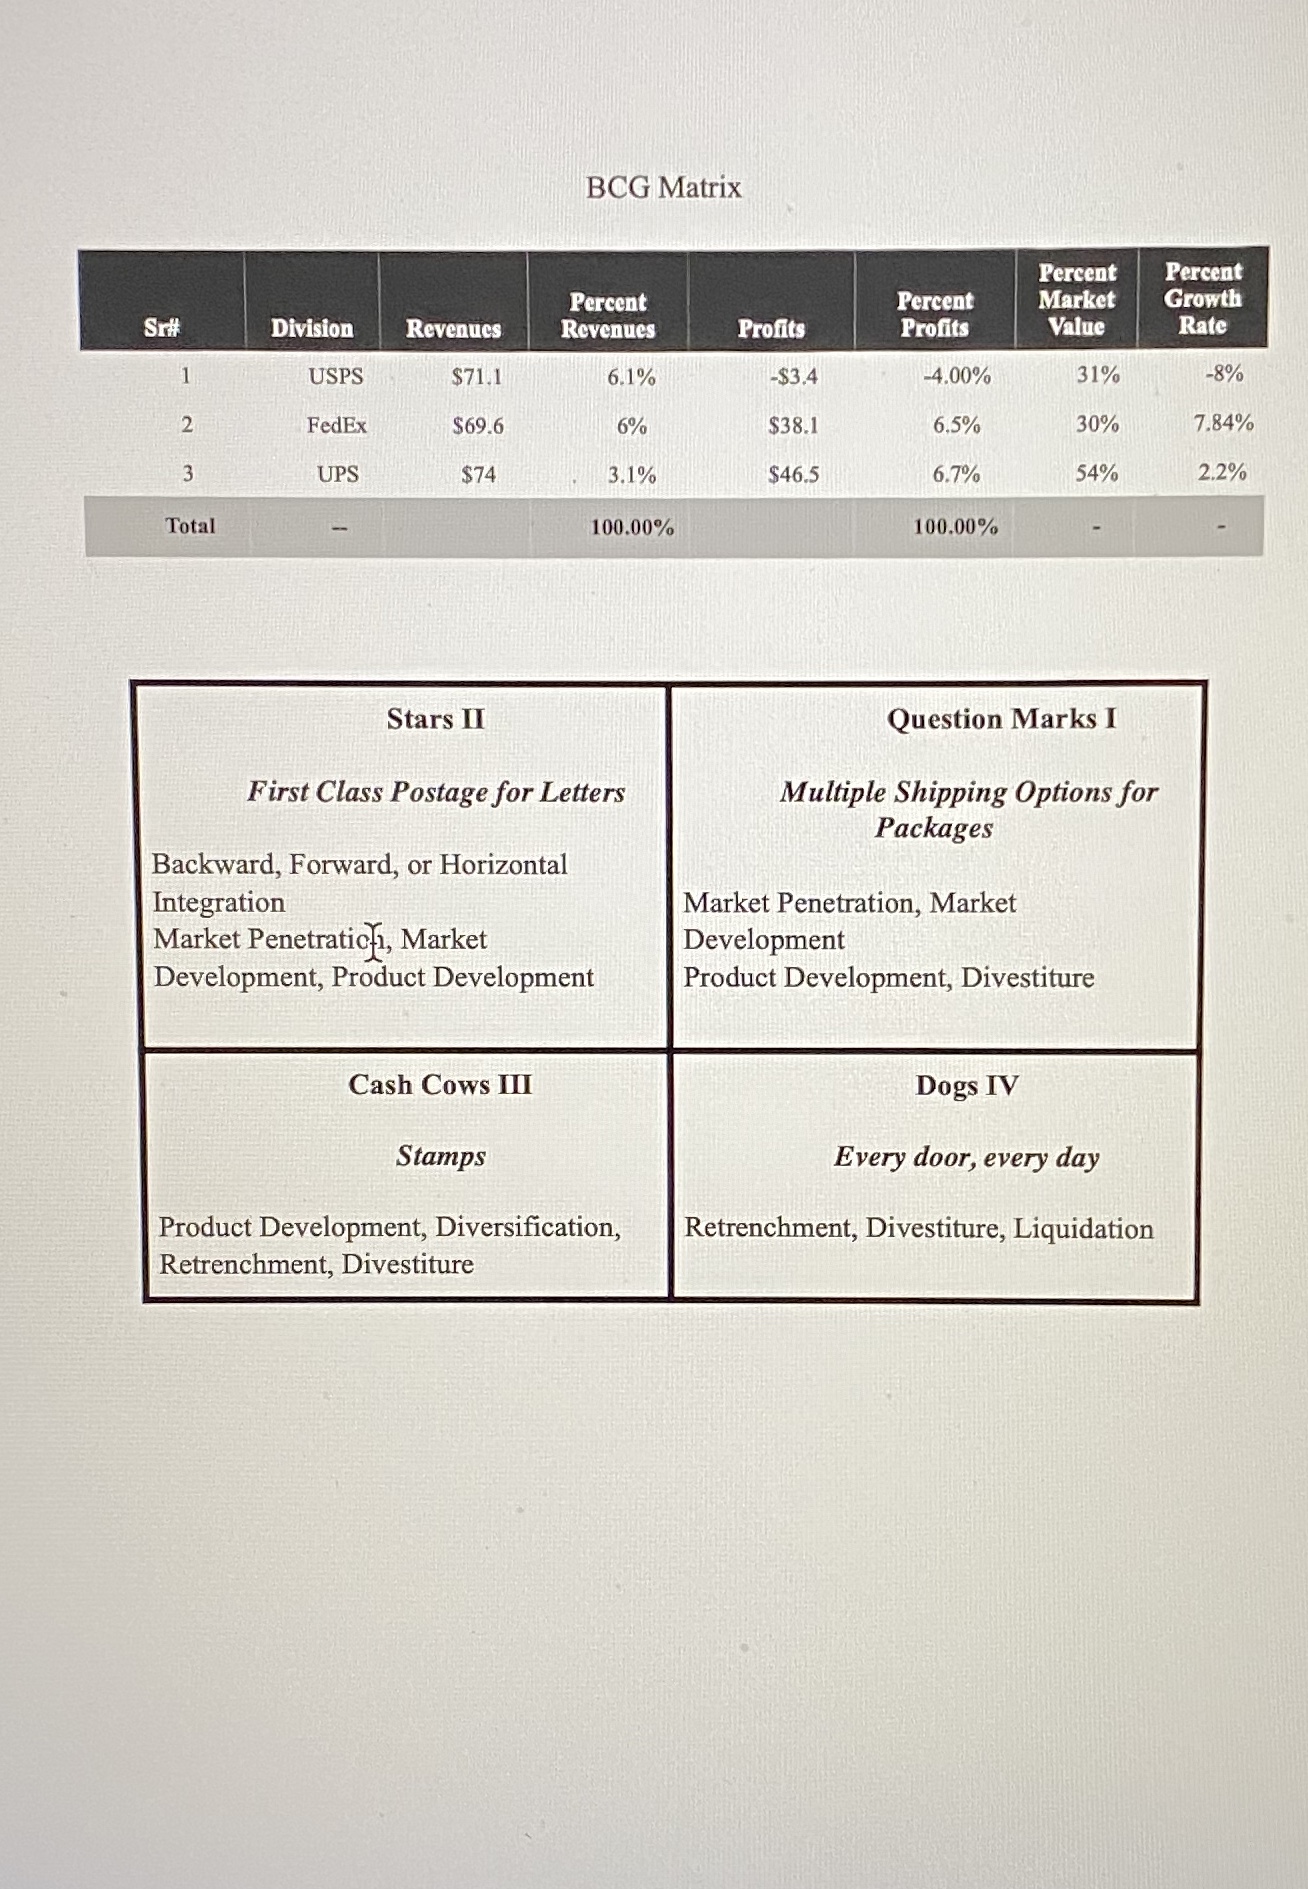
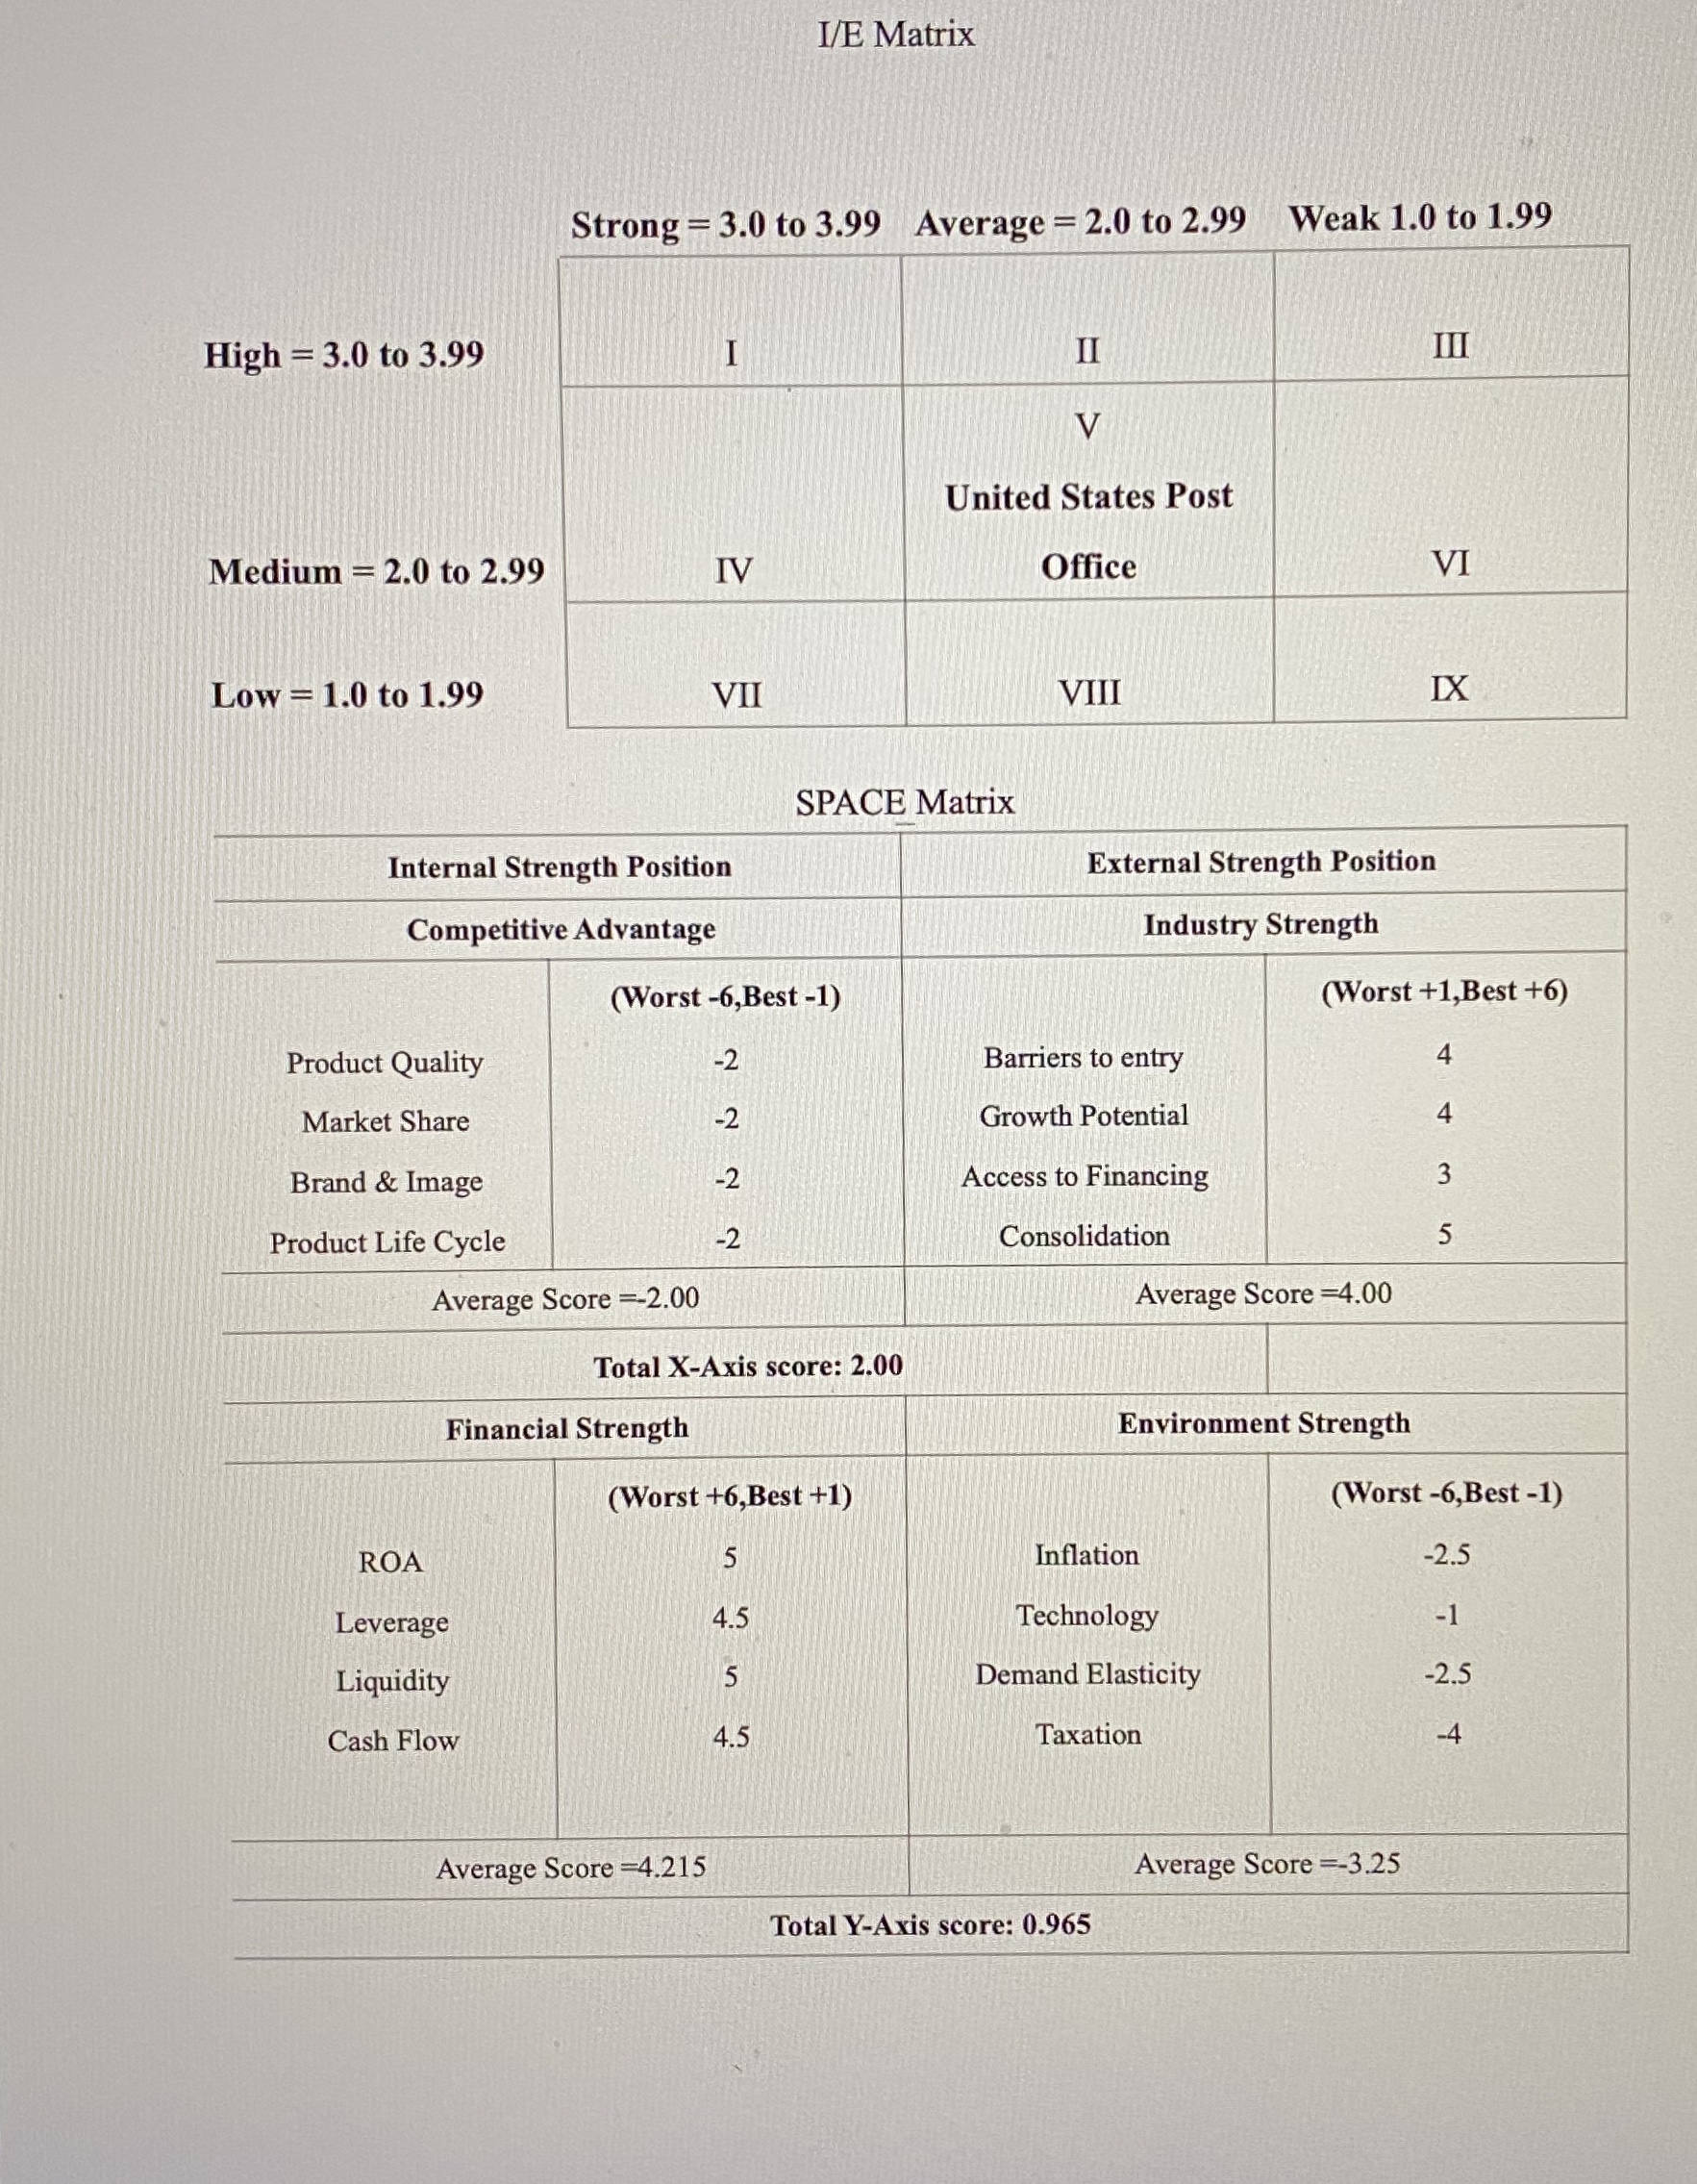
SWOT analysis STRENGTHS WEAKNESSES . Leveled Entry Barriers .Medium & Decreasing Level of . Low Competition in Stamps and First Assistance Class Mail Decline Stages of Life Cycle Minimal Imports .Reduced Profiting Compared to Reduced Production and Service Competitors Average Cortcentrations High Customer Class Concentration Low Capital Requirements Funding is regulated by the Brand Recognition Government OPPORTUNITIES THREATS Unlimited Revenue Growth Potential Very Low Revenue Growth Percentage of business conducted Decreased Growth in Revenue online Zero to No Growth Globally Range of Products Driver Decreased Performance E-Commerce Corporate Profit Location of Facilities Potential ProfitBCG Matrix Percent Percent Percent Percent Market Growth Sri Division Revenues Revenues Profits Profits Value Rate USPS $71.1 6.1% -$3.4 -4.00% 31% -8% N FedEx $69.6 6% $38.1 6.5% 30% 7.84% UPS $74 3.1% $46.5 6.7% 54% 2.2% Total 100.00% 100.00% Stars II Question Marks I First Class Postage for Letters Multiple Shipping Options for Packages Backward, Forward, or Horizontal Integration Market Penetration, Market Market Penetration, Market Development Development, Product Development Product Development, Divestiture Cash Cows III Dogs IV Stamps Every door, every day Product Development, Diversification, Retrenchment, Divestiture, Liquidation Retrenchment, DivestitureI/E Matrix Strong = 3.0 to 3.99 Average = 2.0 to 2.99 Weak 1.0 to 1.99 High = 3.0 to 3.99 II III V United States Post Medium = 2.0 to 2.99 IV Office VI Low = 1.0 to 1.99 VII VIII IX SPACE Matrix Internal Strength Position External Strength Position Competitive Advantage Industry Strength (Worst -6,Best -1) (Worst +1, Best +6) Product Quality -2 Barriers to entry Market Share -2 Growth Potential A Brand & Image -2 Access to Financing Product Life Cycle -2 Consolidation ur w Average Score =-2.00 Average Score =4.00 Total X-Axis score: 2.00 Financial Strength Environment Strength (Worst +6,Best +1) (Worst -6, Best -1) ROA 5 Inflation -2.5 Leverage 45 Technology -1 Liquidity 5 Demand Elasticity -2.5 Cash Flow 4.5 Taxation -4 Average Score =4.215 Average Score =-3.25 Total Y-Axis score: 0.965
Step by Step Solution
There are 3 Steps involved in it

Get step-by-step solutions from verified subject matter experts