

Question: Here is question, only answer part B, I have post the whole question so that you understand the context of question. Analytics Exercise: Forecasting Supply
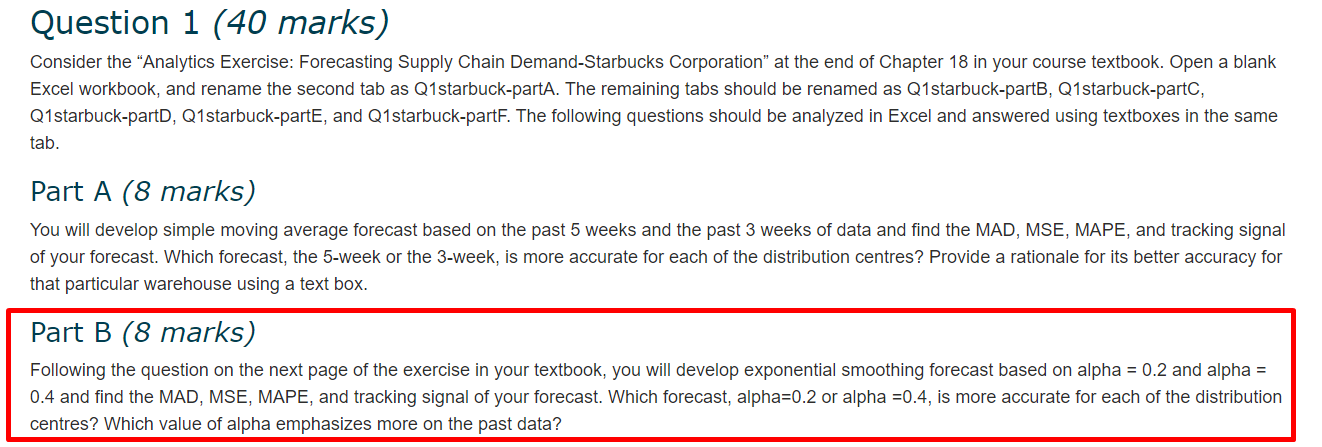
Here is question, only answer part B, I have post the whole question so that you understand the context of question.
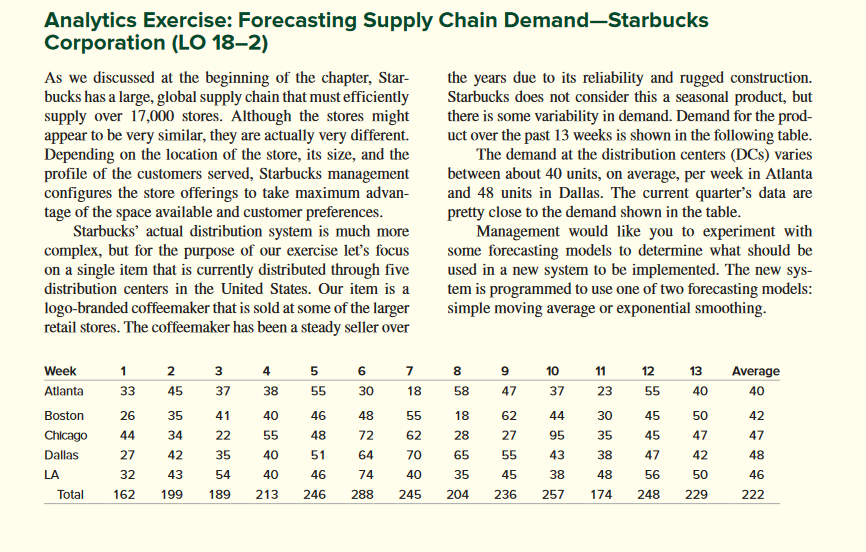
Analytics Exercise: Forecasting Supply Chain Demand-Starbucks Corporation (LO 18-2) As we discussed at the beginning of the chapter, Star- bucks has a large, global supply chain that must efficiently supply over 17,000 stores. Although the stores might appear to be very similar, they are actually very different. Depending on the location of the store, its size, and the profile of the customers served, Starbucks management configures the store offerings to take maximum advan- tage of the space available and customer preferences. Starbucks' actual distribution system is much more complex, but for the purpose of our exercise let's focus on a single item that is currently distributed through five distribution centers in the United States. Our item is a logo-branded coffeemaker that is sold at some of the larger retail stores. The coffeemaker has been a steady seller over the years due to its reliability and rugged construction. Starbucks does not consider this a seasonal product, but there is some variability in demand. Demand for the prod- uct over the past 13 weeks is shown in the following table. The demand at the distribution centers (DCs) varies between about 40 units, on average, per week in Atlanta and 48 units in Dallas. The current quarter's data are pretty close to the demand shown in the table. Management would like you to experiment with some forecasting models to determine what should be used in a new system to be implemented. The new sys- tem is programmed to use one of two forecasting models: simple moving average or exponential smoothing. Week 1 2 3 4 5 6 7 8 9 10 11 12 13 Average Atlanta 33 45 37 38 55 30 18 58 47 37 23 55 Boston 26 35 41 40 46 48 55 18 62 44 30 45 Chicago 44 34 22 55 48 72 62 28 27 95 35 Dallas 27 42 35 40 51 64 70 65 55 43 38 LA 32 43 54 40 46 74 40 35 45 38 48 40 40 50 42 45 47 47 42 48 56 50 46 Total 162 199 189 213 246 288 245 204 236 257 174 248 229 222
Step by Step Solution
There are 3 Steps involved in it
To answer Part B well develop exponential smoothing forecasts for each distribution center using two ... View full answer

Get step-by-step solutions from verified subject matter experts