

Question: Here is my statistic. I did not know how to do the 4 challenges. Use the sample statistics to calculate the control limits for the
Here is my statistic. I did not know how to do the 4 challenges.
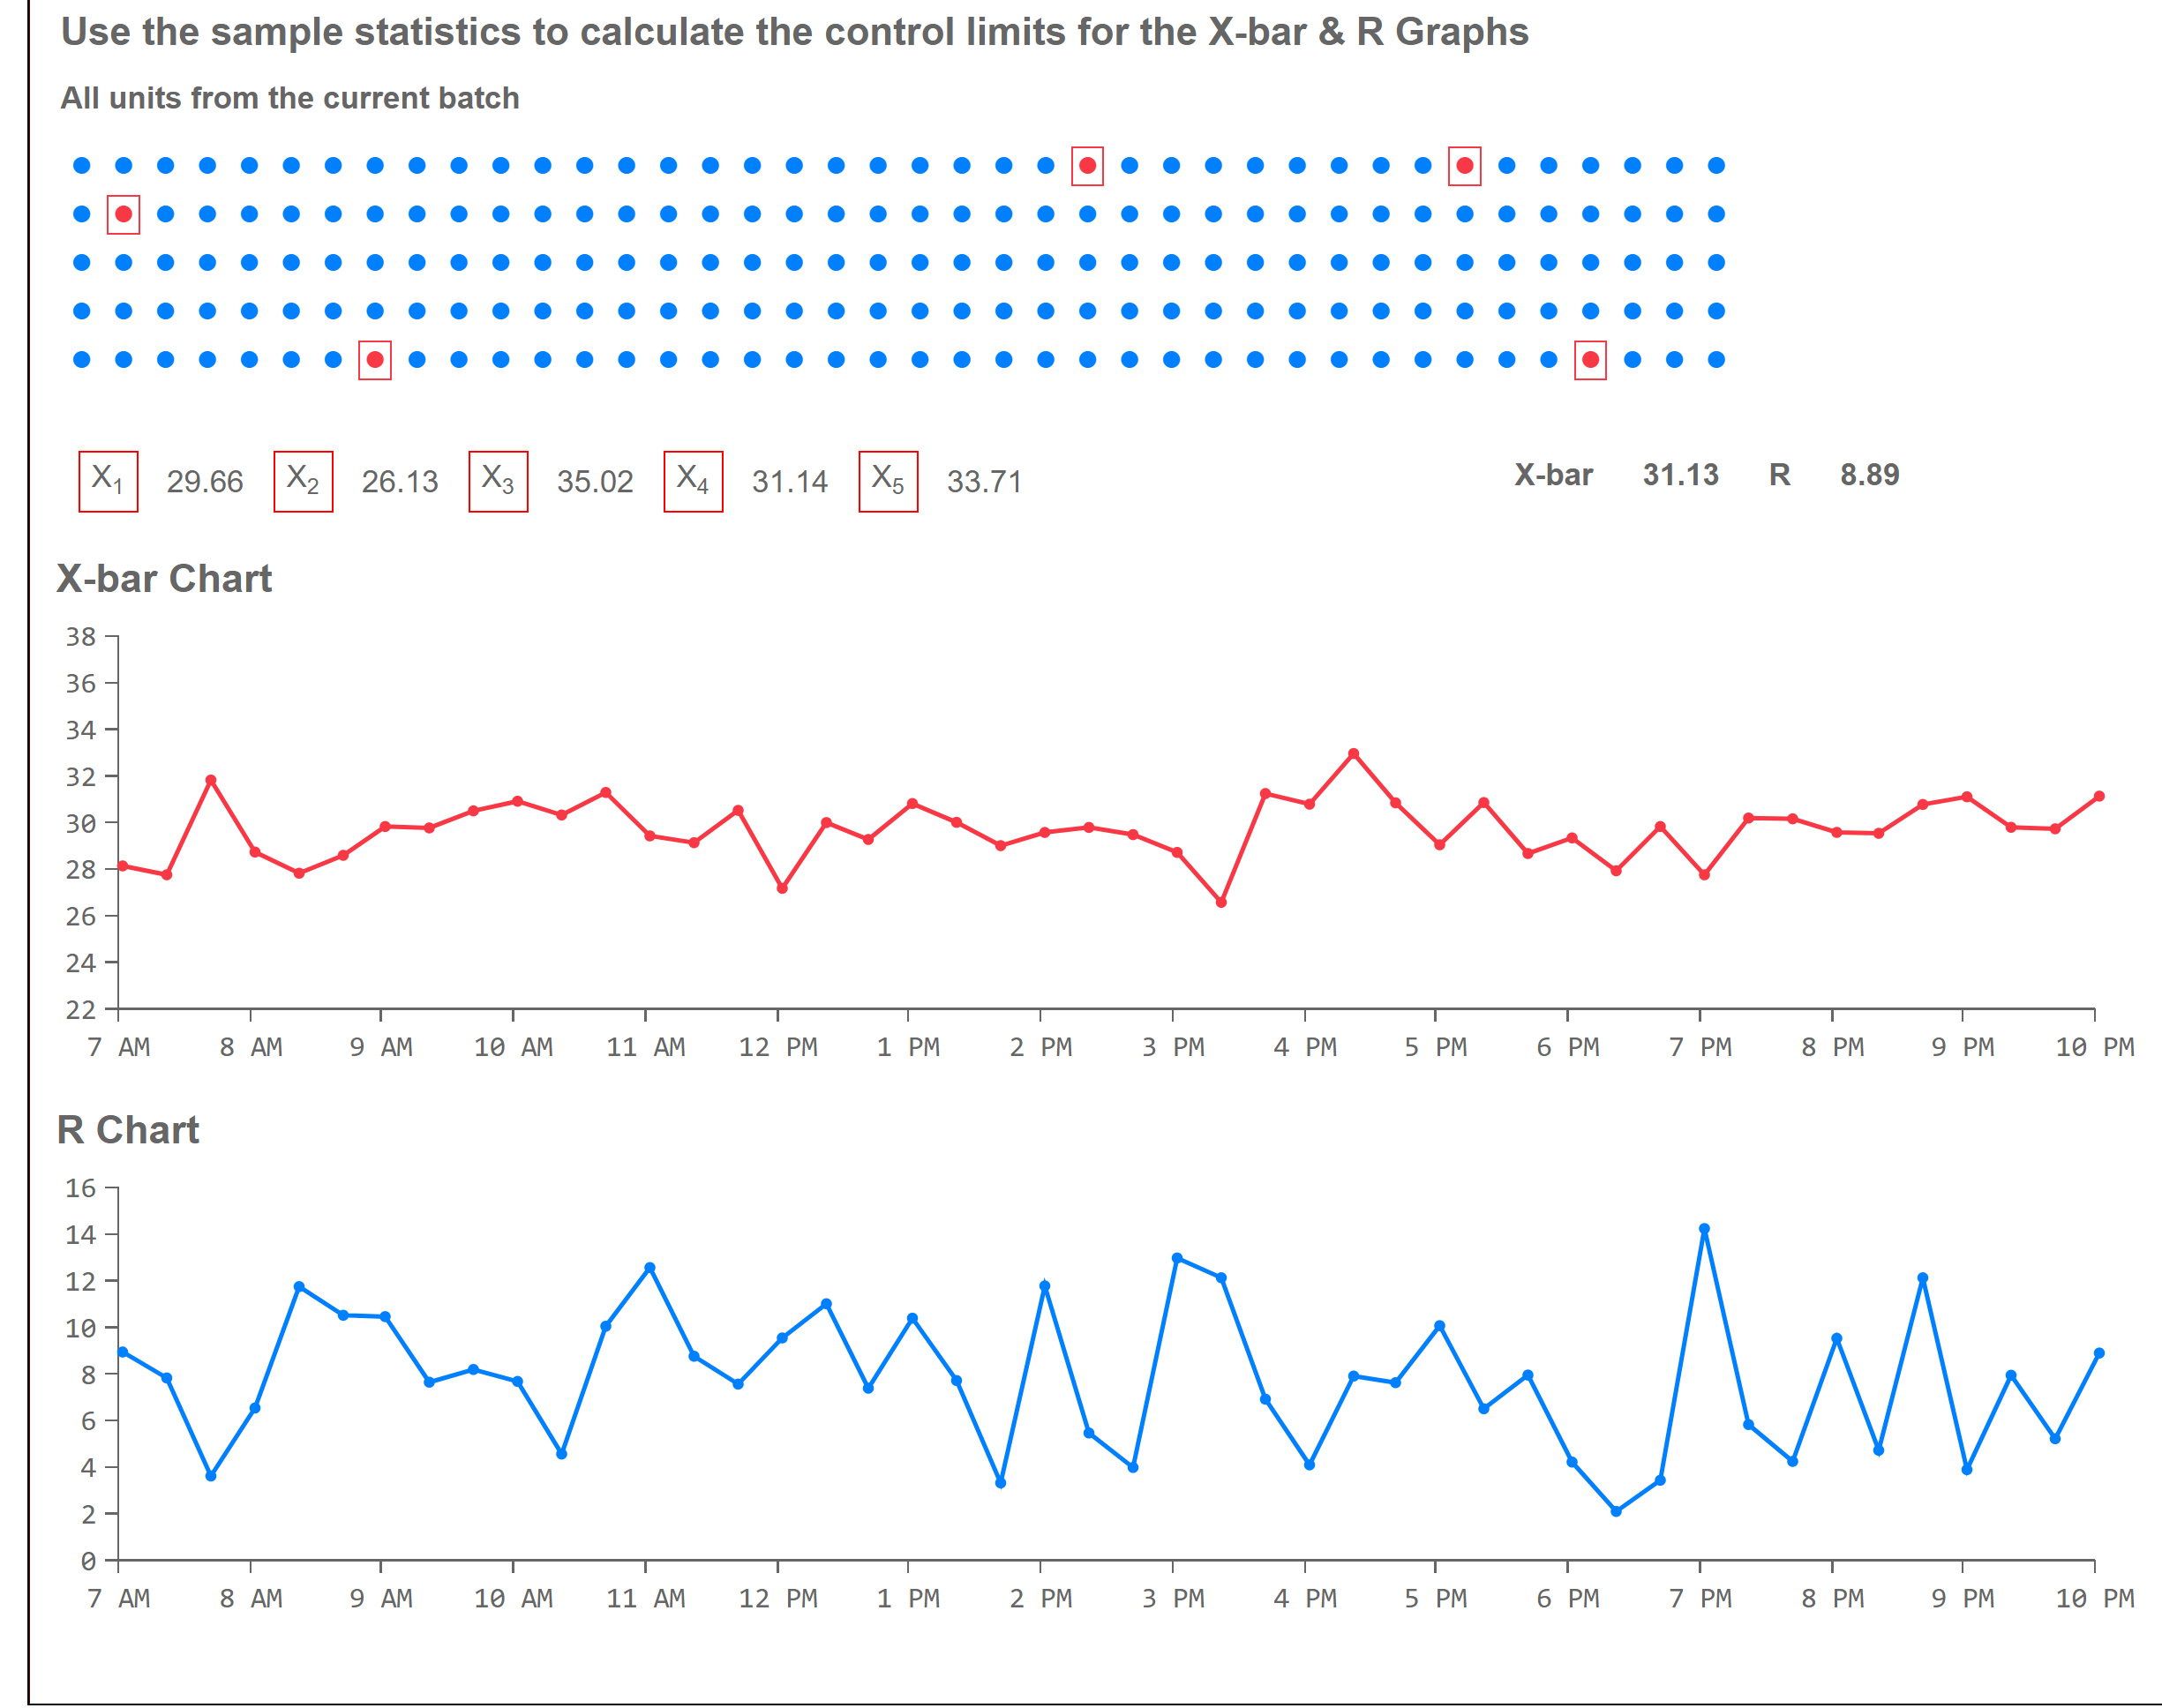
Use the sample statistics to calculate the control limits for the X-bar & R Graphs All units from the current batch X1 29.66 X 2 26.13 X3 35.02 XA 31.14 X5 33.71 X-bar 31.13 R 8.89 X-bar Chart 38 36 34 - 32 30 28 26 24 22 - 7 AM 8 AM 9 AM 10 AM 11 AM 12 PM 1 PM 2 PM 3 PM 4 PM 5 PM 6 PM 7 PM 8 PM 9 PM 10 PM R Chart 16 14 12 10 8 6 4 2 - MyWW 0 - 7 AM 8 AM 9 AM 10 AM 11 AM 12 PM 1 PM 2 PM 3 PM 4 PM 5 PM 6 PM 7 PM 8 PM 9 PM 10 PM
Step by Step Solution
There are 3 Steps involved in it
1 Expert Approved Answer
Step: 1 Unlock

Question Has Been Solved by an Expert!
Get step-by-step solutions from verified subject matter experts
Step: 2 Unlock
Step: 3 Unlock