

Question: Hi, How do you create a one variable table? On the Simulation worksheet, create a one-variable data table that will function as a predictive model
Hi,
How do you create a one variable table?
On the Simulation worksheet, create a one-variable data table that will function as a predictive model by simulating 100 iterations. In cells B8:E8, reference the appropriate cells on the Model worksheet. These references will be hidden, using custom formatting. Create a one-variable data table, using cell L1 as the column input cell.
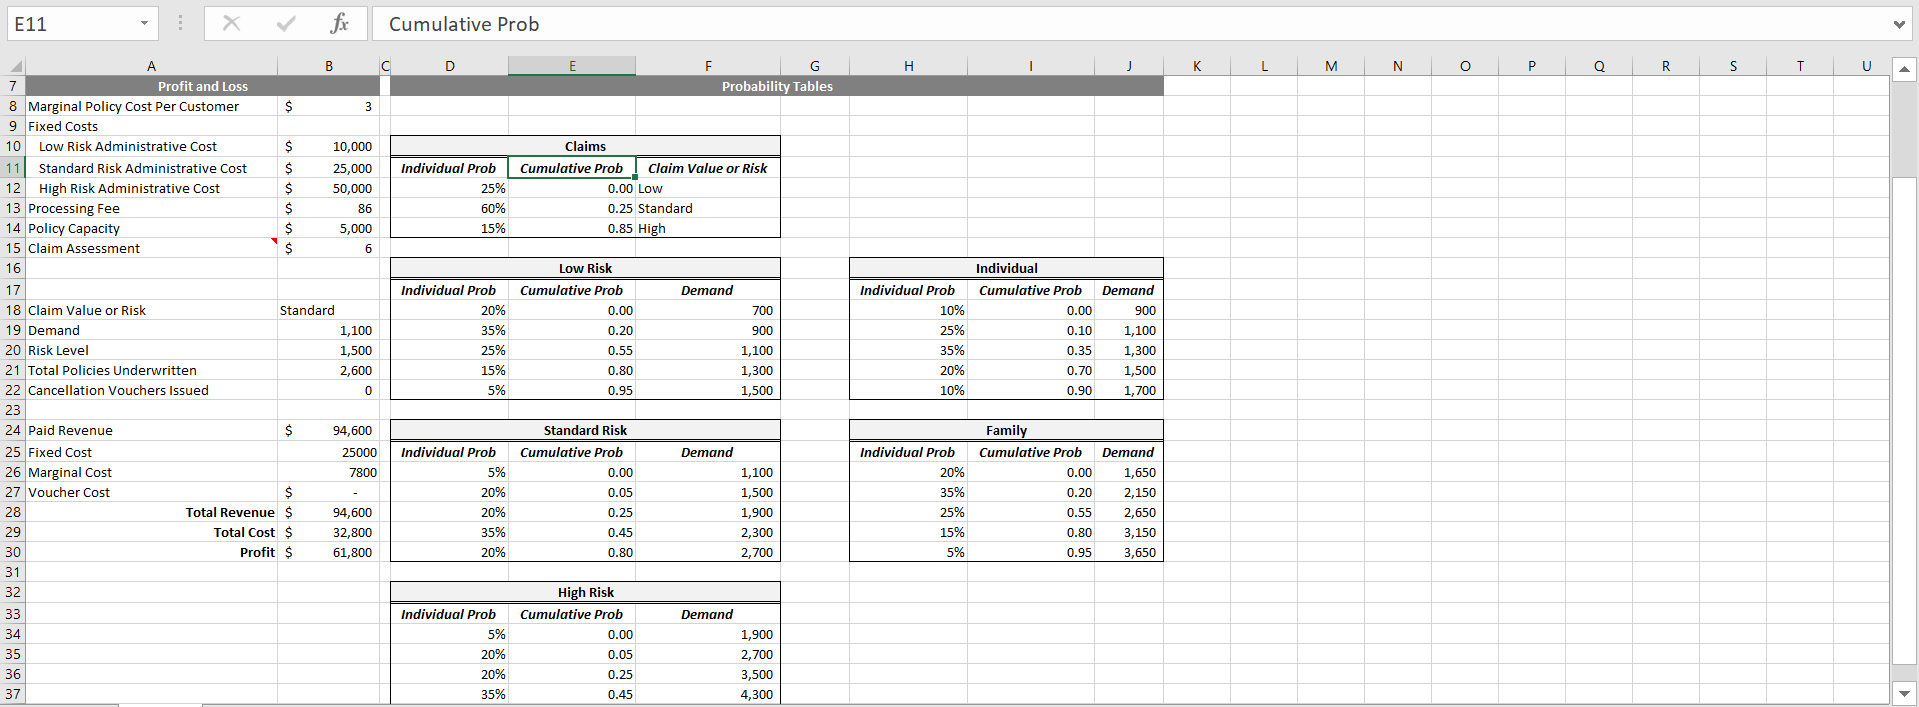
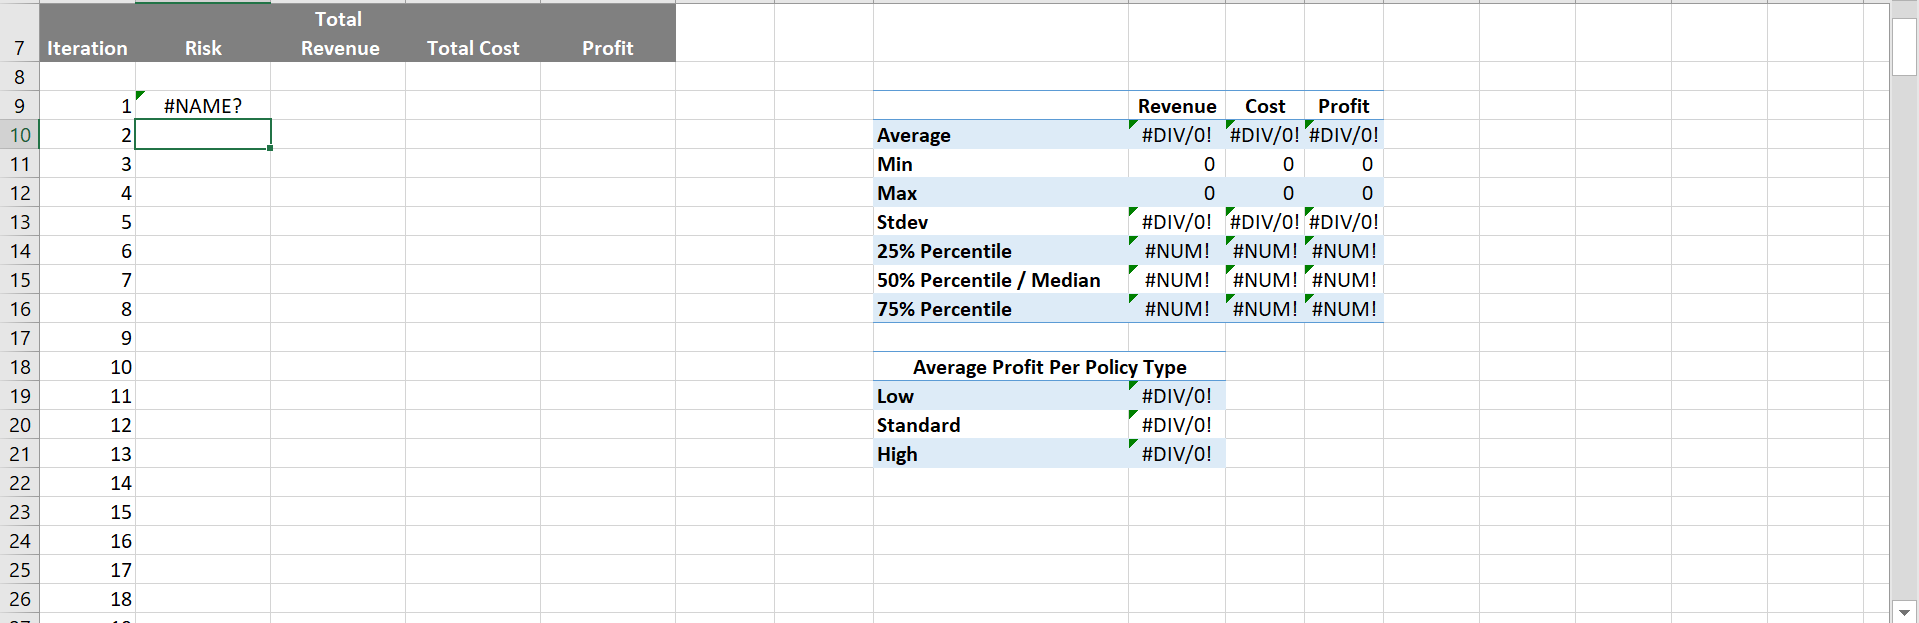
E11 fo Cumulative Prob D E F H K L M N o Q R S T. U G Probability Tables Individual Prob 25% 60% 15% Claims Cumulative Prob Claim Value or Risk 0.00 Low 0.25 Standard 0.85 High Low Risk Cumulative Prob 0.00 A B c 7 Profit and Loss 8 Marginal Policy Cost Per Customer $ 3 9 Fixed Costs 10 Low Risk Administrative Cost $ 10,000 11 Standard Risk Administrative Cost $ 25,000 12 High Risk Administrative Cost $ 50,000 13 Processing Fee $ 86 14 Policy Capacity $ 5,000 15 Claim Assessment $ 6 16 17 18 Claim Value or Risk Standard 19 Demand 1,100 20 Risk Level 1,500 21 Total Policies Underwritten 2,600 22 Cancellation Vouchers Issued 0 23 24 Paid Revenue $ 94,600 25 Fixed Cost 25000 26 Marginal Cost 7800 27 Voucher Cost $ 28 Total Revenue $ 94,600 29 Total Cost $ 32,800 30 Profit $ 61,800 31 32 33 34 35 36 37 Individual Prob 20% 35% 25% 15% 5% 0.20 0.55 0.80 0.95 Demand 700 900 1,100 1,300 1,500 Individual Prob 10% 25% 35% 20% 10% Individual Cumulative Prob 0.00 0.10 0.35 0.70 0.90 Demand 900 1,100 1,300 1,500 1,700 Individual Prob 5% 20% 20% 35% 20% Standard Risk Cumulative Prob 0.00 0.05 0.25 0.45 0.80 Demand 1,100 1,500 1,900 2,300 2,700 Individual Prob 20% 35% 25% 15% 5% Family Cumulative Prob 0.00 0.20 0.55 0.80 0.95 Demand 1,650 2,150 2,650 3,150 3,650 Individual Prob 5% 20% 20% 35% High Risk Cumulative Prob 0.00 0.05 0.25 0.45 Demand 1,900 2,700 3,500 4,300 Total Revenue 7 Iteration Risk Total Cost Profit 8 9 1 #NAME? 10 2 11 3 12 4 Revenue Cost Profit #DIV/0! #DIV/0!'#DIV/0! 0 0 0 0 0 0 #DIV/0! #DIV/0! #DIV/0! #NUM! "#NUM!'#NUM! #NUM! #NUM! #NUM! #NUM! #NUM! #NUM! 13 Average Min Max Stdev 25% Percentile 50% Percentile / Median 75% Percentile 5 14 6 7 15 16 8 17 9 18 10 19 11 12 Average Profit Per Policy Type Low #DIV/0! Standard #DIV/0! High #DIV/0! 13 14 20 21 22 23 24 25 15 16 17 26 18 E11 fo Cumulative Prob D E F H K L M N o Q R S T. U G Probability Tables Individual Prob 25% 60% 15% Claims Cumulative Prob Claim Value or Risk 0.00 Low 0.25 Standard 0.85 High Low Risk Cumulative Prob 0.00 A B c 7 Profit and Loss 8 Marginal Policy Cost Per Customer $ 3 9 Fixed Costs 10 Low Risk Administrative Cost $ 10,000 11 Standard Risk Administrative Cost $ 25,000 12 High Risk Administrative Cost $ 50,000 13 Processing Fee $ 86 14 Policy Capacity $ 5,000 15 Claim Assessment $ 6 16 17 18 Claim Value or Risk Standard 19 Demand 1,100 20 Risk Level 1,500 21 Total Policies Underwritten 2,600 22 Cancellation Vouchers Issued 0 23 24 Paid Revenue $ 94,600 25 Fixed Cost 25000 26 Marginal Cost 7800 27 Voucher Cost $ 28 Total Revenue $ 94,600 29 Total Cost $ 32,800 30 Profit $ 61,800 31 32 33 34 35 36 37 Individual Prob 20% 35% 25% 15% 5% 0.20 0.55 0.80 0.95 Demand 700 900 1,100 1,300 1,500 Individual Prob 10% 25% 35% 20% 10% Individual Cumulative Prob 0.00 0.10 0.35 0.70 0.90 Demand 900 1,100 1,300 1,500 1,700 Individual Prob 5% 20% 20% 35% 20% Standard Risk Cumulative Prob 0.00 0.05 0.25 0.45 0.80 Demand 1,100 1,500 1,900 2,300 2,700 Individual Prob 20% 35% 25% 15% 5% Family Cumulative Prob 0.00 0.20 0.55 0.80 0.95 Demand 1,650 2,150 2,650 3,150 3,650 Individual Prob 5% 20% 20% 35% High Risk Cumulative Prob 0.00 0.05 0.25 0.45 Demand 1,900 2,700 3,500 4,300 Total Revenue 7 Iteration Risk Total Cost Profit 8 9 1 #NAME? 10 2 11 3 12 4 Revenue Cost Profit #DIV/0! #DIV/0!'#DIV/0! 0 0 0 0 0 0 #DIV/0! #DIV/0! #DIV/0! #NUM! "#NUM!'#NUM! #NUM! #NUM! #NUM! #NUM! #NUM! #NUM! 13 Average Min Max Stdev 25% Percentile 50% Percentile / Median 75% Percentile 5 14 6 7 15 16 8 17 9 18 10 19 11 12 Average Profit Per Policy Type Low #DIV/0! Standard #DIV/0! High #DIV/0! 13 14 20 21 22 23 24 25 15 16 17 26 18
Step by Step Solution
There are 3 Steps involved in it

Get step-by-step solutions from verified subject matter experts