

Question: Hi, I need help with this problem in LINGO: The Darby Company manufactures and distributes meters used to measure electric power consumption. The company started
Hi, I need help with this problem in LINGO:
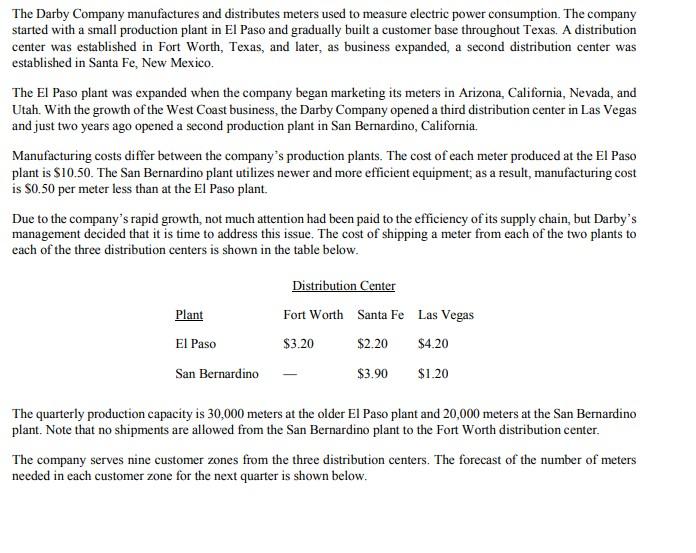
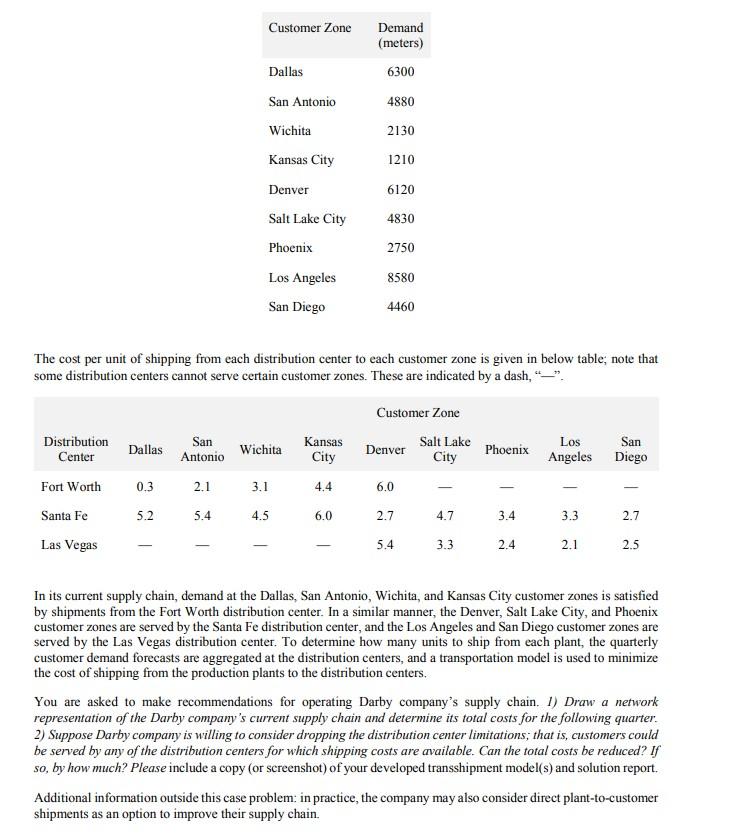
The Darby Company manufactures and distributes meters used to measure electric power consumption. The company started with a small production plant in El Paso and gradually built a customer base throughout Texas. A distribution center was established in Fort Worth, Texas, and later, as business expanded, a second distribution center was established in Santa Fe, New Mexico. The El Paso plant was expanded when the company began marketing its meters in Arizona, California, Nevada, and Utah. With the growth of the West Coast business, the Darby Company opened a third distribution center in Las Vegas and just two years ago opened a second production plant in San Bernardino, California. Manufacturing costs differ between the company's production plants. The cost of each meter produced at the El Paso plant is $10.50. The San Bernardino plant utilizes newer and more efficient equipment, as a result, manufacturing cost is $0.50 per meter less than at the El Paso plant. Due to the company's rapid growth, not much attention had been paid to the efficiency of its supply chain, but Darby's management decided that it is time to address this issue. The cost of shipping a meter from each of the two plants to each of the three distribution centers is shown in the table below. Plant Distribution Center Fort Worth Santa Fe Las Vegas $3.20 $2.20 $4.20 $3.90 $1.20 El Paso San Bernardino The quarterly production capacity is 30,000 meters at the older El Paso plant and 20,000 meters at the San Bernardino plant. Note that no shipments are allowed from the San Bernardino plant to the Fort Worth distribution center. The company serves nine customer zones from the three distribution centers. The forecast of the number of meters needed in each customer zone for the next quarter is shown below. Customer Zone Demand (meters) 6300 Dallas 4880 San Antonio Wichita 2130 Kansas City 1210 Denver 6120 4830 Salt Lake City Phoenix 2750 8580 Los Angeles San Diego 4460 The cost per unit of shipping from each distribution center to each customer zone is given in below table, note that some distribution centers cannot serve certain customer zones. These are indicated by a dash, Distribution Center Customer Zone Salt Lake Denver City Dallas San Antonio Wichita Kansas City Phoenix Los Angeles San Diego Fort Worth 0.3 2.1 3.1 4.4 6.0 5.2 5.4 4.5 6.0 2.7 4.7 3.4 3.3 2.7 Santa Fe Las Vegas 5.4 - 3.3 1 2.4 2.1 2.5 In its current supply chain, demand at the Dallas, San Antonio, Wichita, and Kansas City customer zones is satisfied by shipments from the Fort Worth distribution center. In a similar manner, the Denver, Salt Lake City, and Phoenix customer zones are served by the Santa Fe distribution center, and the Los Angeles and San Diego customer zones are served by the Las Vegas distribution center. To determine how many units to ship from each plant, the quarterly customer demand forecasts are aggregated at the distribution centers, and a transportation model is used to minimize the cost of shipping from the production plants to the distribution centers. You are asked to make recommendations for operating Darby company's supply chain. 1) Draw a network representation of the Darby company's current supply chain and determine its total costs for the following quarter. 2) Suppose Darby company is willing to consider dropping the distribution center limitations, that is, customers could be served by any of the distribution centers for which shipping costs are available. Can the total costs be reduced? If so, by how much? Please include a copy (or screenshot) of your developed transshipment model(s) and solution report. Additional information outside this case problem: in practice, the company may also consider direct plant-to-customer shipments as an option to improve their supply chain
Step by Step Solution
There are 3 Steps involved in it
1 Expert Approved Answer
Step: 1 Unlock

Question Has Been Solved by an Expert!
Get step-by-step solutions from verified subject matter experts
Step: 2 Unlock
Step: 3 Unlock