

Question: Hi I'm having a problem solving this problem. My professor explained it to us but I'm still having problems understanding. Can someone please explain how
Hi I'm having a problem solving this problem. My professor explained it to us but I'm still having problems understanding. Can someone please explain how I'm supposed to solve a problem like this?
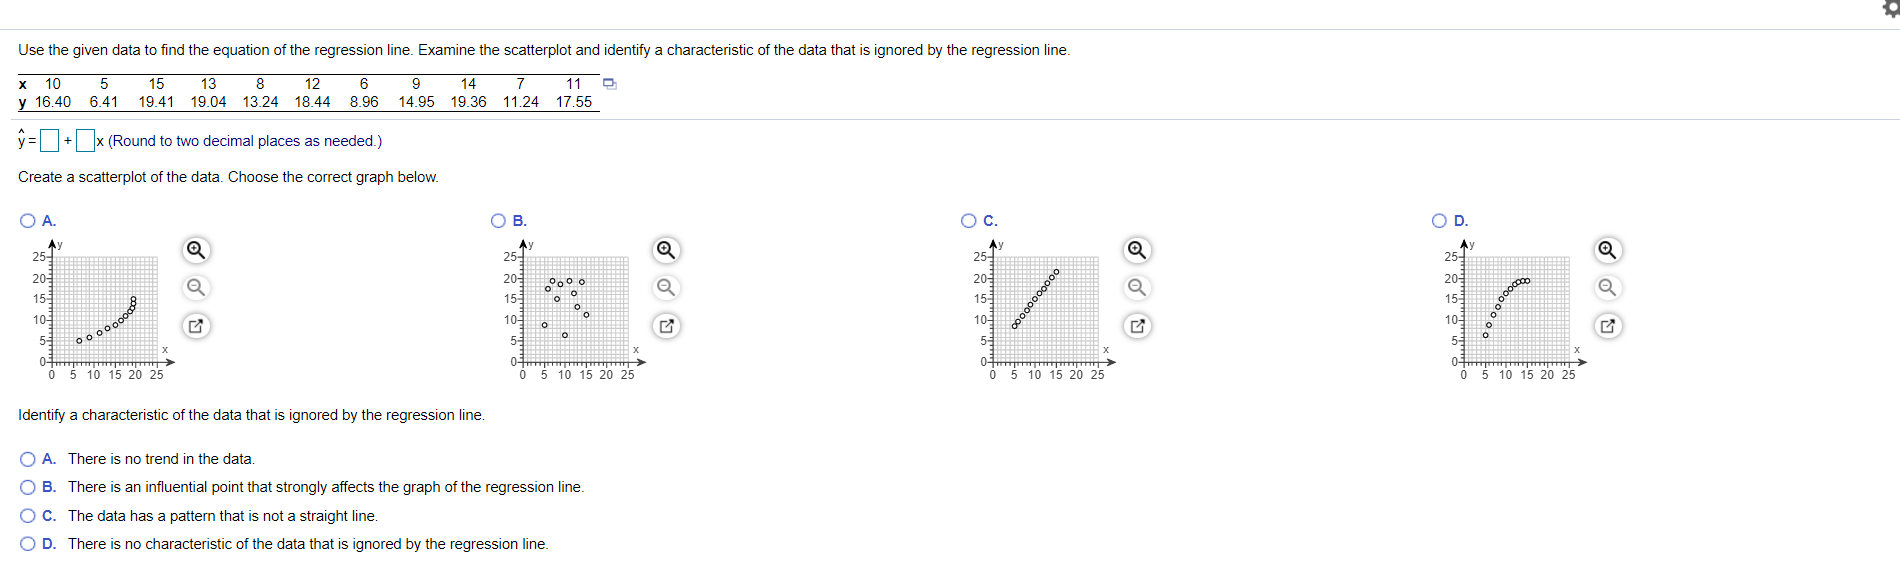
Use the given data to find the equation of the regression line. Examine the scatterplot and identify a characteristic of the data that is ignored by the regression line. x 10 5 15 13 8 12 6 9 14 11 9 y 16.40 6.41 19.41 19.04 13.24 18.44 8.96 14.95 19.36 11.24 17.55 y=+x (Round to two decimal places as needed.) Create a scatterplot of the data. Choose the correct graph below. O A. O B. O c. O D. 25- Q 25 25- 25- 20- Q 20- 20- 20- 15- 15- 15 10 105 5- 5-3 5 5 10 15 20 25 5 10 15 20 25 5 10 15 20 25 5 10 15 20 25 Identify a characteristic of the data that is ignored by the regression line. O A. There is no trend in the data O B. There is an influential point that strongly affects the graph of the regression line. O C. The data has a pattern that is not a straight line. O D. There is no characteristic of the data that is ignored by the regression line
Step by Step Solution
There are 3 Steps involved in it

Get step-by-step solutions from verified subject matter experts