

Question: Hi there, below is the question that I am trying to solve: This is what I have tried and it doesn't seem to be working
Hi there, below is the question that I am trying to solve:
This is what I have tried and it doesn't seem to be working for me:
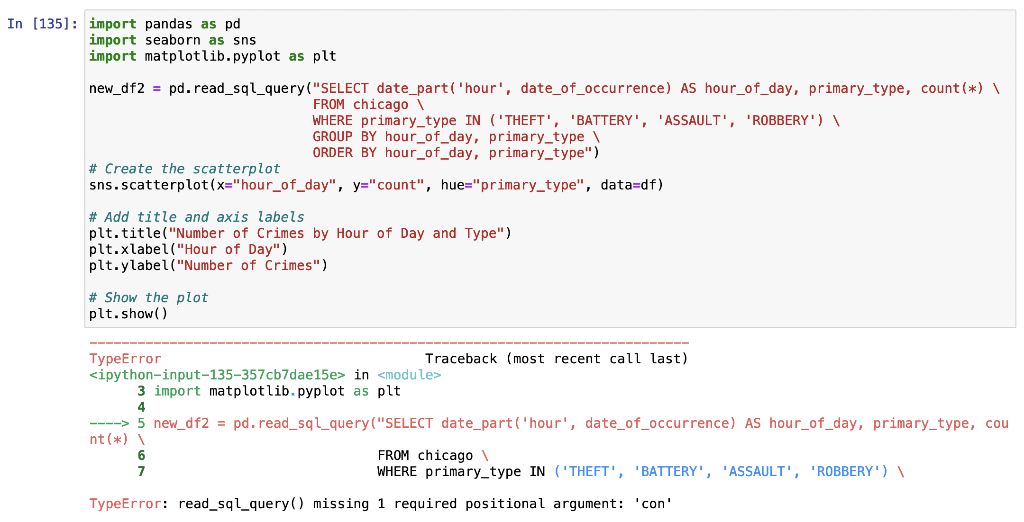
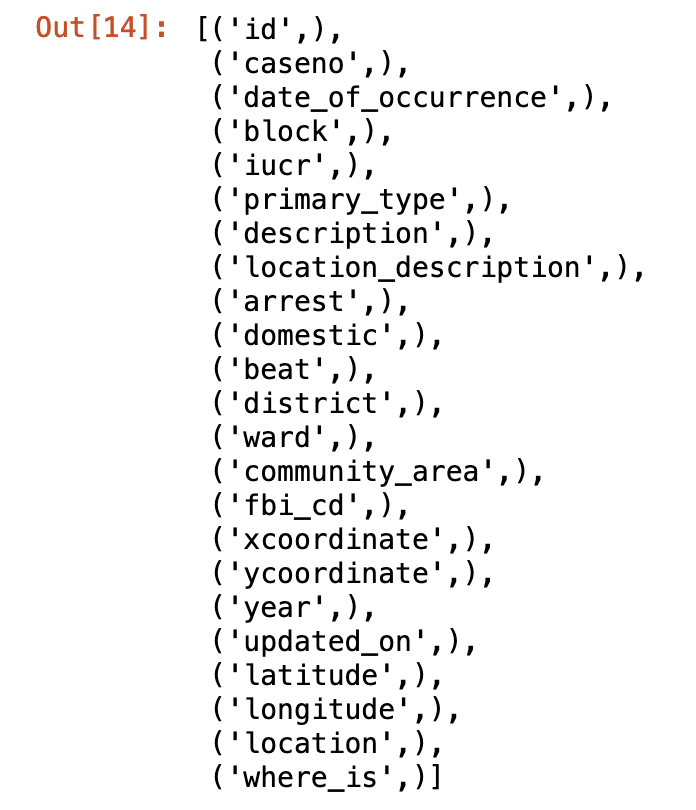
The first table I am working with below is called chicago. The primary_type column includes Theft,, battery, assault, etc.
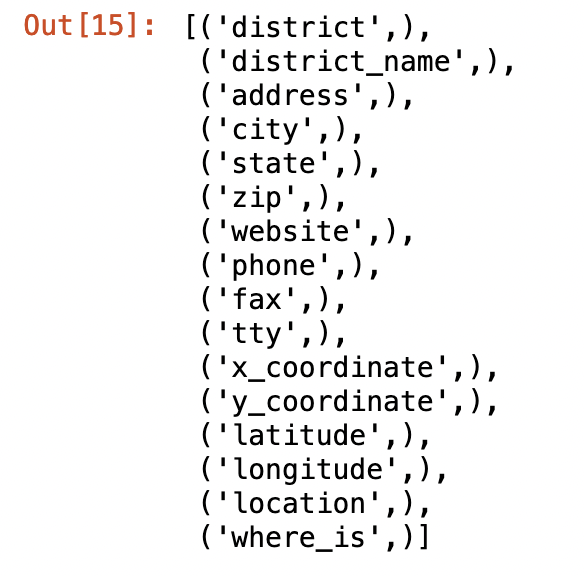
The second table is called police_stations
Any help is appreciated!
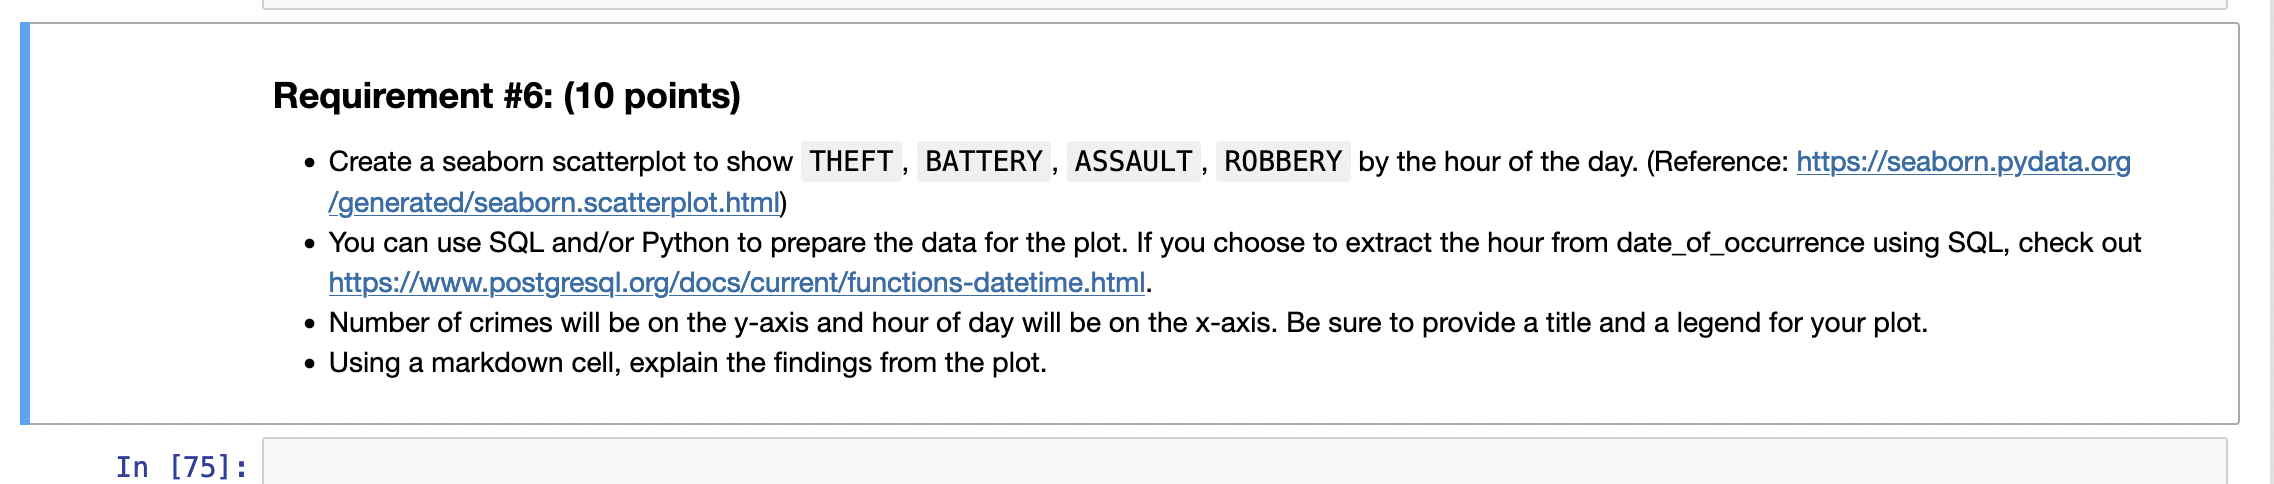
Requirement \#6: (10 points) - Create a seaborn scatterplot to show THEFT, BATTERY, ASSAULT, ROBBERY by the hour of the day. (Reference: https://seaborn.pydata.org - You can use SQL and/or Python to prepare the data for the plot. If you choose to extract the hour from date_of_occurrence using SQL, check out https://www.postgresql.org/docs/current/functions-datetime.html. - Number of crimes will be on the y-axis and hour of day will be on the x-axis. Be sure to provide a title and a legend for your plot. - Using a markdown cell, explain the findings from the plot. Requirement \#6: (10 points) - Create a seaborn scatterplot to show THEFT, BATTERY, ASSAULT, ROBBERY by the hour of the day. (Reference: https://seaborn.pydata.org - You can use SQL and/or Python to prepare the data for the plot. If you choose to extract the hour from date_of_occurrence using SQL, check out https://www.postgresql.org/docs/current/functions-datetime.html. - Number of crimes will be on the y-axis and hour of day will be on the x-axis. Be sure to provide a title and a legend for your plot. - Using a markdown cell, explain the findings from the plot
Step by Step Solution
There are 3 Steps involved in it

Get step-by-step solutions from verified subject matter experts