

Question: How can I forecast the numbers for year 15,16,17 using excel? Footwear Operations in North America Historical Operating Performance Year 12 Year 13 Year 14
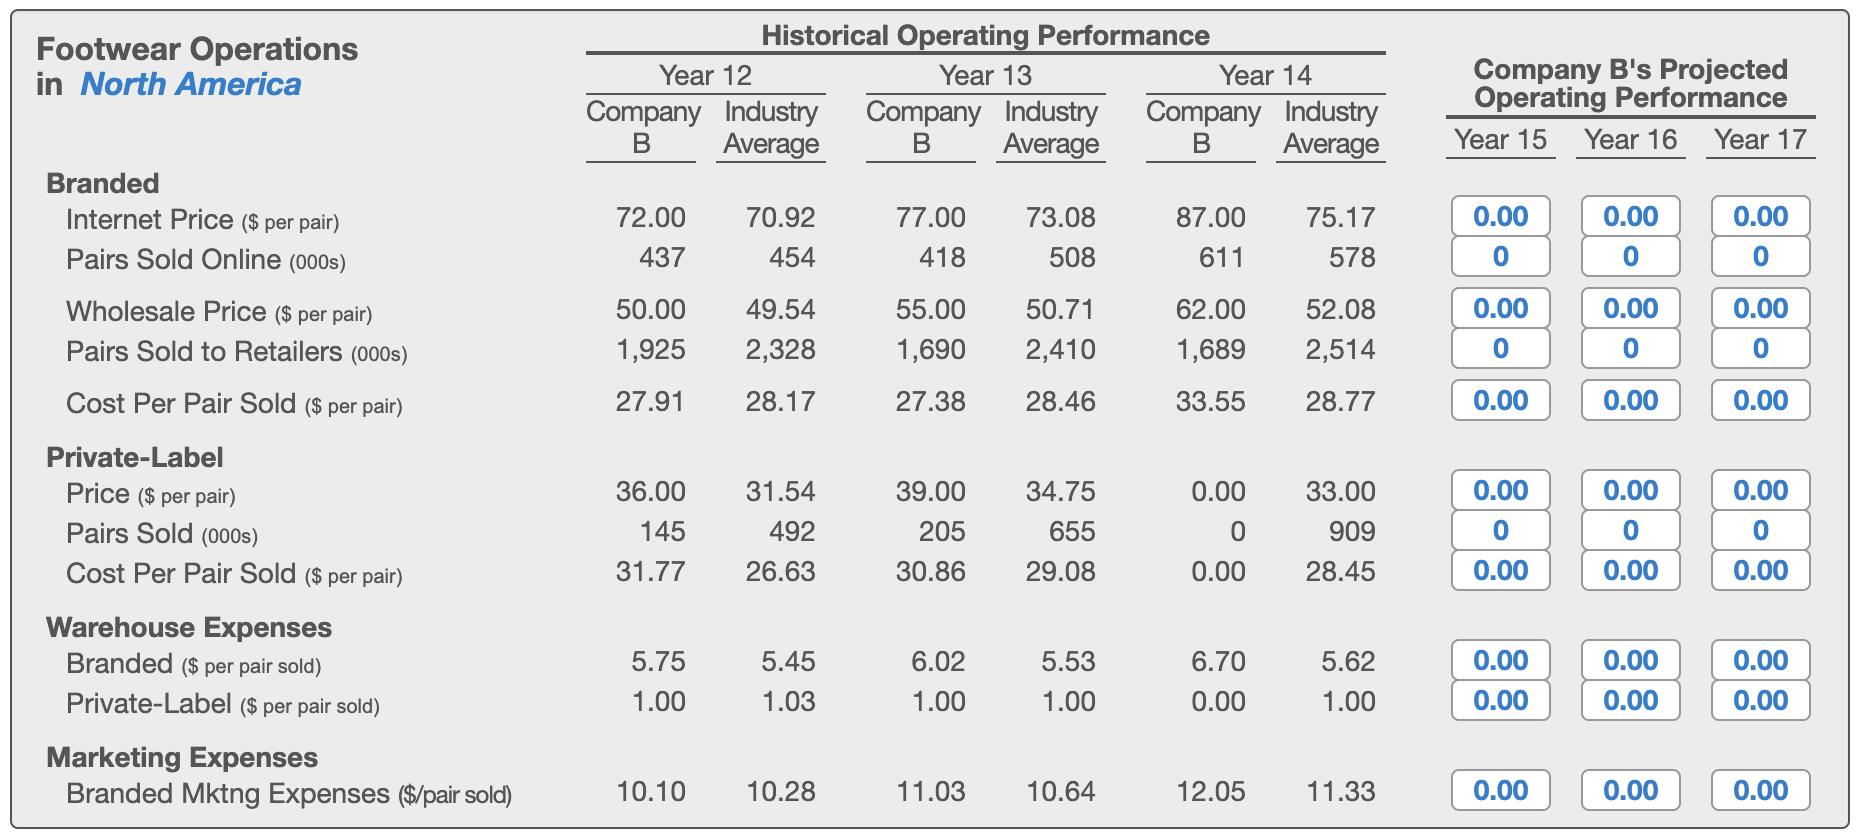 How can I forecast the numbers for year 15,16,17 using excel?
Step by Step Solution
There are 3 Steps involved in it
1 Expert Approved Answer
Step: 1 Unlock

Question Has Been Solved by an Expert!
Get step-by-step solutions from verified subject matter experts
Step: 2 Unlock
Step: 3 Unlock