

Question: How do we find SS and DF? Field MY MF FY A A A B Plant Height (Y) 11 13 9 16 22 23 19
How do we find SS and DF?
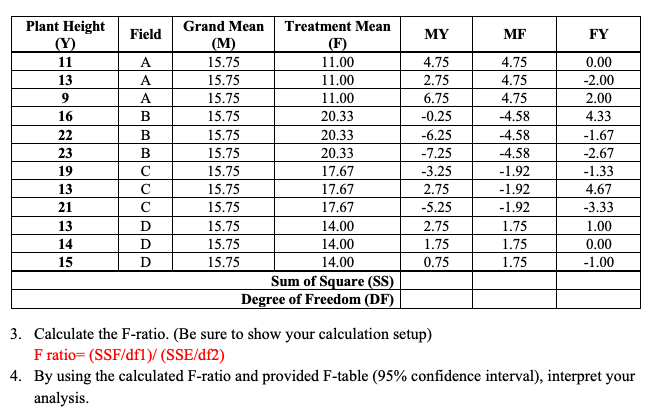
Field MY MF FY A A A B Plant Height (Y) 11 13 9 16 22 23 19 13 21 13 14 15 B B D D D Grand Mean Treatment Mean (M) 15.75 11.00 15.75 11.00 15.75 11.00 15.75 20.33 15.75 20.33 15.75 20.33 15.75 17.67 15.75 17.67 15.75 17.67 15.75 14.00 15.75 14.00 15.75 14.00 Sum of Square (SS) Degree of Freedom (DF) 4.75 2.75 6.75 -0.25 -6.25 -7.25 -3.25 2.75 -5.25 2.75 1.75 0.75 4.75 4.75 4.75 -4.58 -4.58 -4.58 -1.92 -1.92 -1.92 1.75 1.75 1.75 0.00 -2.00 2.00 4.33 -1.67 -2.67 -1.33 4.67 -3.33 1.00 0.00 -1.00 3. Calculate the F-ratio. (Be sure to show your calculation setup) F ratio=(SSF/dfl)/(SSE/df2) 4. By using the calculated F-ratio and provided F-table (95% confidence interval), interpret your analysis. Field MY MF FY A A A B Plant Height (Y) 11 13 9 16 22 23 19 13 21 13 14 15 B B D D D Grand Mean Treatment Mean (M) 15.75 11.00 15.75 11.00 15.75 11.00 15.75 20.33 15.75 20.33 15.75 20.33 15.75 17.67 15.75 17.67 15.75 17.67 15.75 14.00 15.75 14.00 15.75 14.00 Sum of Square (SS) Degree of Freedom (DF) 4.75 2.75 6.75 -0.25 -6.25 -7.25 -3.25 2.75 -5.25 2.75 1.75 0.75 4.75 4.75 4.75 -4.58 -4.58 -4.58 -1.92 -1.92 -1.92 1.75 1.75 1.75 0.00 -2.00 2.00 4.33 -1.67 -2.67 -1.33 4.67 -3.33 1.00 0.00 -1.00 3. Calculate the F-ratio. (Be sure to show your calculation setup) F ratio=(SSF/dfl)/(SSE/df2) 4. By using the calculated F-ratio and provided F-table (95% confidence interval), interpret your analysis
Step by Step Solution
There are 3 Steps involved in it

Get step-by-step solutions from verified subject matter experts