

Question: How will you collect data for this experiment? virtually Time and Temperature Data: Cooling Curves of DI Water Mass of culture tube + 250-ml beaker
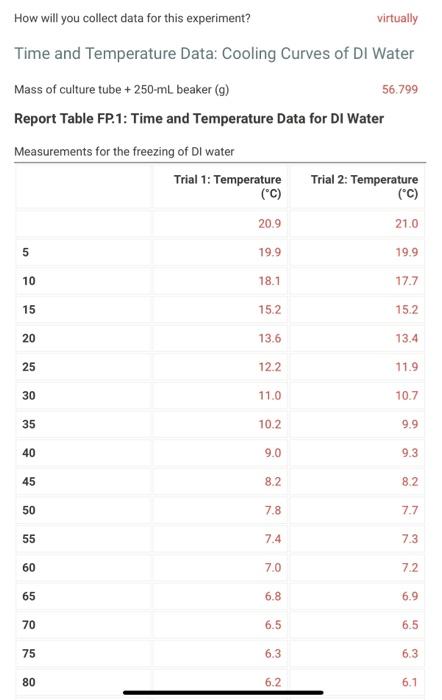
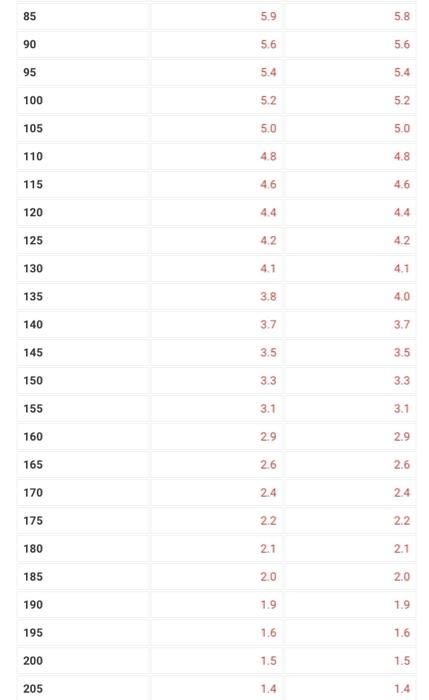
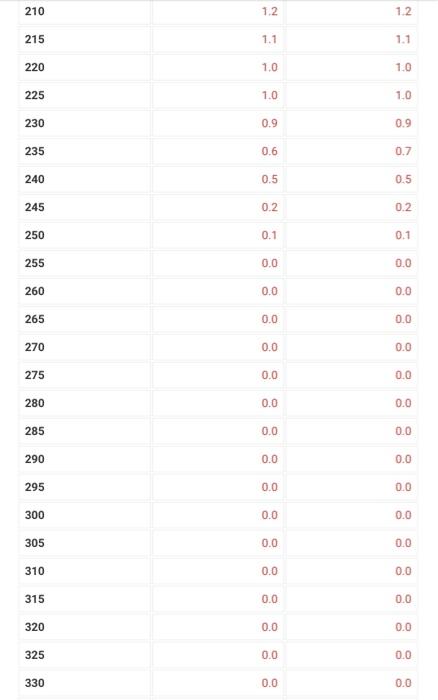
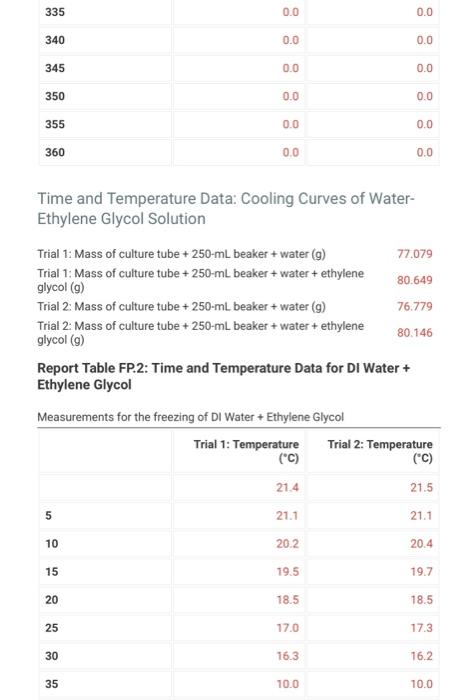
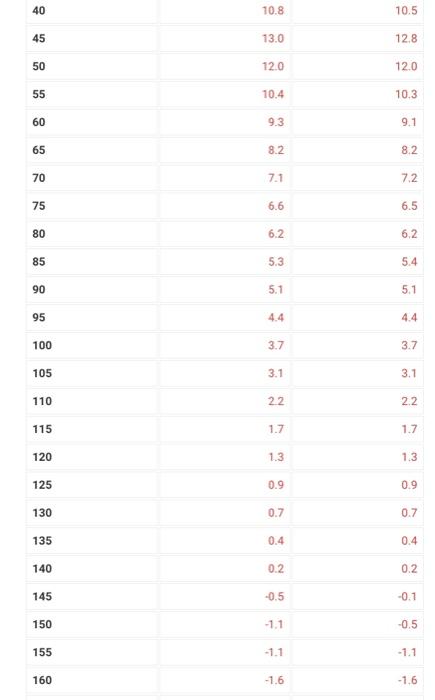
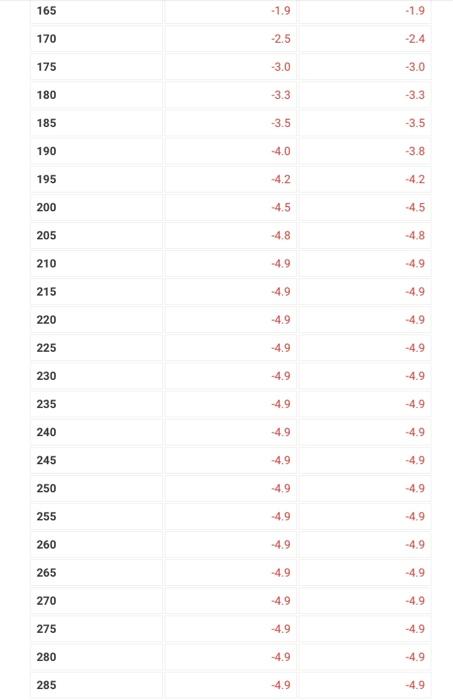
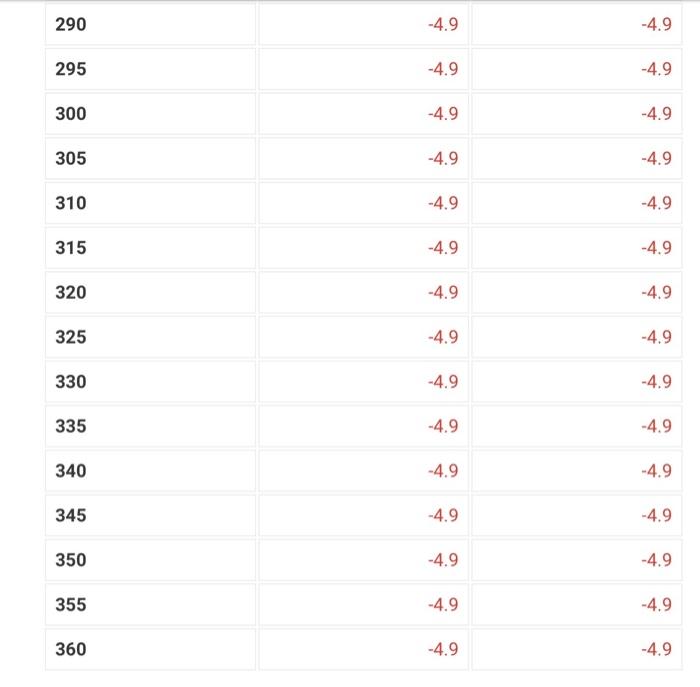
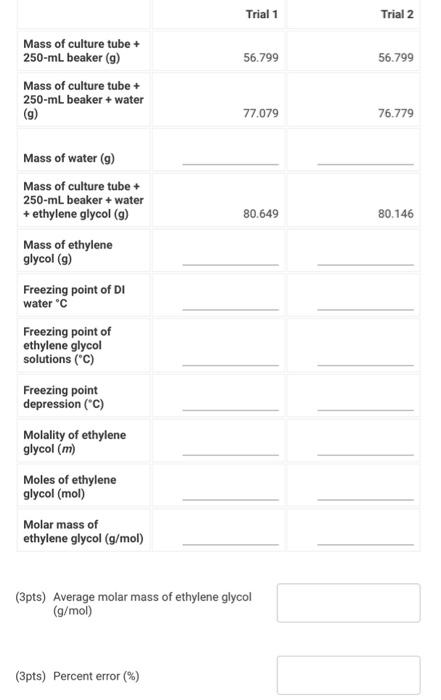
How will you collect data for this experiment? virtually Time and Temperature Data: Cooling Curves of DI Water Mass of culture tube + 250-ml beaker (9) 56.799 Report Table FP.1: Time and Temperature Data for Di Water Measurements for the freezing of Dl water Trial 1: Temperature Trial 2: Temperature (C) (C) 20.9 21.0 5 19.9 19.9 10 18.1 17.7 15 15.2 15.2 20 13.6 13.4 25 12.2 11.9 30 11.0 10.7 35 10.2 9.9 40 9.0 9.3 45 8.2 8.2. 50 7.8 7.7 55 7.4 7.3 60 7.0 7.2. 65 6.8 6.9 70 6.5 6.5 75 6.3 6.3 80 6.2 6.1 85 5.9 5.8 90 5.6 5 5.6 95 5.4 5.4 100 5.2 5.2 105 5.0 5.0 110 48 4.8 115 4.6 4.6 120 4.4 4.4 125 4.2 4.2 130 4.1 4.1 135 3.8 4.0 140 3.1 3.7 145 3.5 3.5 150 3.3 3.3 155 3.1 3.1 160 2.9 2.9 165 26 2.6 170 2.4 2.4 175 2.2. 22 180 21 2.1 185 20 2.0 190 1.9 1.9 195 1.6 1.6 200 1.5 1.5 205 1.4 1.4 210 1.2 12 215 1.1 1.1 220 1.0 1.0 225 1.0 1.0 230 0.9 0.9 235 0.6 0.7 240 0.5 0.5 245 0.2 0.2 250 0.1 0.1 255 0.0 0.0 260 0.0 0.0 265 0.0 0.0 270 0.0 0.0 275 0.0 0.0 280 0.0 0.0 285 0.0 0.0 290 0.0 0.0 295 0.0 0.0 300 0.0 0.0 305 0.0 0.0 310 0.0 0.0 315 0.0 0.0 320 0.0 0.0 325 0.0 0.0 330 0.0 0.0 335 0.0 0.0 340 0.0 0.0 345 0.0 0.0 350 0.0 0.0 355 0.0 0.0 360 0.0 0.0 Time and Temperature Data: Cooling Curves of Water- Ethylene Glycol Solution Trial 1: Mass of culture tube + 250-ml beaker + water (9) 77.079 Trial 1: Mass of culture tube + 250-ml beaker + water + ethylene glycol (g) 80.649 Trial 2: Mass of culture tube + 250-ml beaker + water (g) 76.779 Trial 2 Mass of culture tube + 250-ml beaker + water + ethylene 80.146 glycol (9) Report Table FP.2: Time and Temperature Data for DI Water + Ethylene Glycol Measurements for the freezing of DI Water + Ethylene Glycol Trial 1: Temperature Trial 2: Temperature (C) (C) 21.4 21.5 21.1 5 21.1 10 20.2 20.4 15 19.5 19.7 20 18.5 18.5 25 17.0 17.3 30 16.3 16.2 35 100 10.0 40 10.8 10.5 45 13.0 12.8 50 120 12.0 55 10.4 10.3 60 9.3 9.1 65 8.2 8.2 70 7.1 7.2 75 6.6 6.5 80 6.2 6.2 85 5.3 5.4 90 5.1 5.1 95 4.4 4.4 100 3.7 3.7 105 3.1 3.1 110 22 2.2 115 1.7 1.7 120 1.3 1.3 125 0.9 0.9 130 0.7 0.7 0 135 0.4 0.4 140 0.2 0.2 145 -0.5 -0.1 150 -1.1 -0.5 155 -1.1 -1.1 160 -1.6 -1.6 165 -1.9 -1.9 170 -2.5 -2.4 175 -3.0 -3.0 180 -3.3 -3.3 185 -3.5 -3.5 190 -4.0 -3.8 195 -4.2 -4.2 200 -4.5 -4.5 205 -4.8 210 -4.9 -4.9 215 -4.9 -4.9 220 -4.9 -4.9 225 -4.9 -4.9 230 -4.9 -4.9 235 -4.9 -4.9 240 -4.9 -4.9 245 -4.9 -4.9 250 -4.9 -4.9 255 -4.9 -4.9 260 -4.9 -4.9 265 -4.9 -4.9 270 -4.9 -4.9 275 -4.9 -4.9 280 -4.9 -4.9 285 -4.9 -4.9 290 -4.9 -4.9 295 -4.9 -4.9 300 -4.9 -4.9 305 -4.9 -4.9 310 -4.9 -4.9 315 -4.9 -4.9 320 -4.9 -4.9 325 -4.9 -4.9 330 -4.9 -4.9 335 -4.9 -4.9 340 -4.9 -4.9 345 -4.9 -4.9 350 -4.9 -4.9 355 -4.9 -4.9 360 -4.9 -4.9 Trial 1 Trial 2 56.799 56.799 Mass of culture tube + 250-ml beaker (9) Mass of culture tube + 250-ml beaker + water (9) 77.079 76.779 Mass of water (9) Mass of culture tube + 250-ml beaker + water + ethylene glycol (9) 80.649 80.146 Mass of ethylene glycol (9) Freezing point of DI water C Freezing point of ethylene glycol solutions (C) Freezing point depression (C) Molality of ethylene glycol (m) Moles of ethylene glycol (mol) Molar mass of ethylene glycol (g/mol) (3pts) Average molar mass of ethylene glycol (g/mol) (3pts) Percent error (%)
Step by Step Solution
There are 3 Steps involved in it

Get step-by-step solutions from verified subject matter experts