

Question: How would you interpret and compare the data from the table and bar graph from Company M and Company JWN? Keep the following questions in
How would you interpret and compare the data from the table and bar graph from Company M and Company JWN? Keep the following questions in mind when interpreting and comparing the data:
-what proportion of the companys assets are financed with debt ?
-what is the relationship between equity and total assets?
-what is the margin of safety in the ability to repay interest payments?
what is the margin of safety in the ability to repay interest payments?
*Remember Leverage Ratios are used to measure the extent to which non-owner supplied funds have been used to finance the companys assets and there are two types:
-balance sheet leverage ratios
-coverage ratios
This data uses leverage ratio analysis for the years 2016-2019s financial statements.
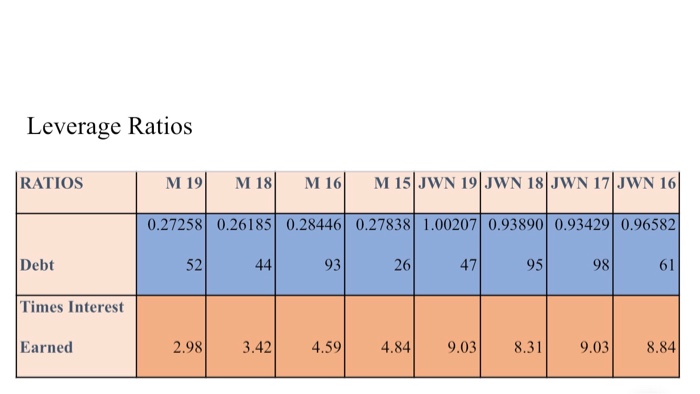
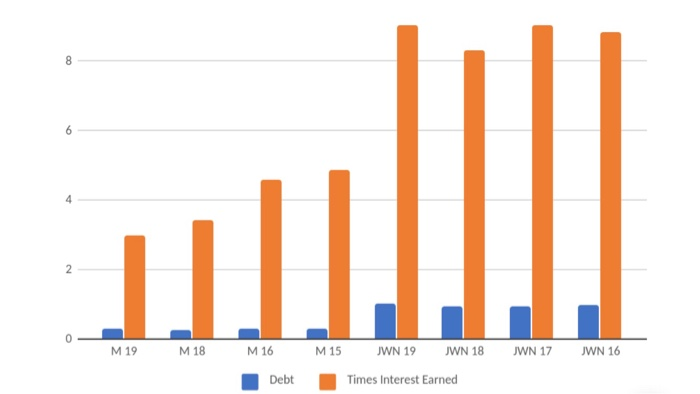
Leverage Ratios RATIOS M 190 M 18 M 16 M 15 JWN 19 JWN 18|JWN 17|JWN 16| 0.27258 0.26185 0.28446 0.27838 1.00207 0.93890 0.93429 0.96582 Debt 52 44 93 20 47 95 98 Times Interest Earned 2.98 3.42 4.59 4.84 9.03 8.31 .03 8.84 M19 M18 JWN 17 JWN 16 M16 Debt M15 JWN 19 JWN 18 Times Interest Earned Leverage Ratios RATIOS M 190 M 18 M 16 M 15 JWN 19 JWN 18|JWN 17|JWN 16| 0.27258 0.26185 0.28446 0.27838 1.00207 0.93890 0.93429 0.96582 Debt 52 44 93 20 47 95 98 Times Interest Earned 2.98 3.42 4.59 4.84 9.03 8.31 .03 8.84 M19 M18 JWN 17 JWN 16 M16 Debt M15 JWN 19 JWN 18 Times Interest Earned
Step by Step Solution
There are 3 Steps involved in it
1 Expert Approved Answer
Step: 1 Unlock

Question Has Been Solved by an Expert!
Get step-by-step solutions from verified subject matter experts
Step: 2 Unlock
Step: 3 Unlock