

Question: How would you interpret and compare the data from the table and bar graph from Company M and Company JWN? Keep the following questions in
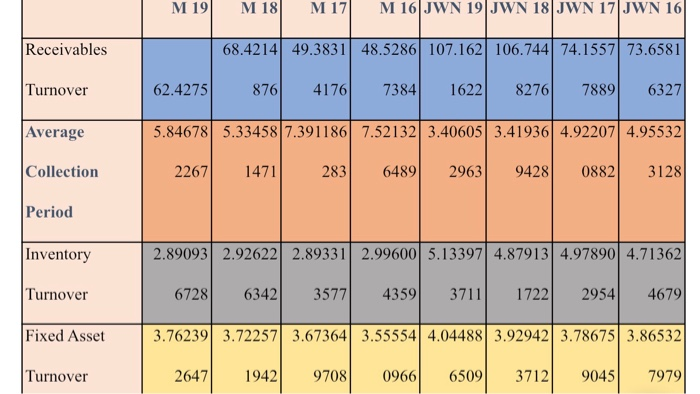
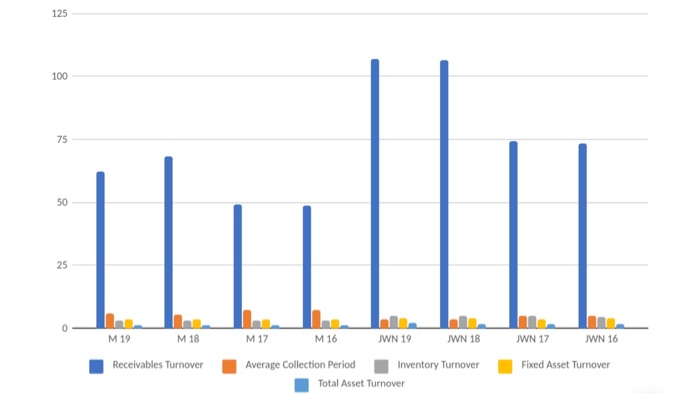
M 19 M18M17 M 16 JWN 19 JWN 18 JWN 17 JWN 16|| Receivables 68.4214 49.3831 48.5286 107.162 106.744 74.1557 73.6581 876 4176 7384 1622 8276 7889|| Turnover 62.4275 6327 Average 5.84678 5.33458 7.3911867.52132 3.40605 3.41936 4.92207 4.95532 Collection 2267 1471 283 6489 2963 9428 0882|| 3128 Period Inventory Turnover 2.89093 2.92622 2.89331 2.99600 5.13397 4.87913 4.97890 4.71362 67286342 3577 4359 3711 1722 29544679 3.76239 3.72257 3.67364 3.55554 4.04488 3.92942 3.78675 3.86532 2647 1942 9708 0966 6509 3712 9045 7979 Fixed Asset Turnover 02 M 19 M 18 M17 M 16 JWN 19 WN 18 JWN 17 JWN 16 Receivables Turnover Fixed Asset Turnover Average Collection Period Inventory Turnover Total Asset Turnover
Step by Step Solution
There are 3 Steps involved in it

Get step-by-step solutions from verified subject matter experts