

Question: How would you interpret and compare the data from the table and bar graph for Company M and Company JWN? Keep the folowing questions when
How would you interpret and compare the data from the table and bar graph for Company M and Company JWN? Keep the folowing questions when interpreting and comparing the given data:
-Does the data show there is a sufficent amount of current assets to pay off current liabilities? what is the cushion of safety?
-What happens to the companys ability to repay current liabikities after the least liquid of the current assets is subtracted?
-What proportion of Total Assets is dedicated to short-term liquidity?
The data uses liquidty ratio analayis for the years 2016-2019's financial statment.
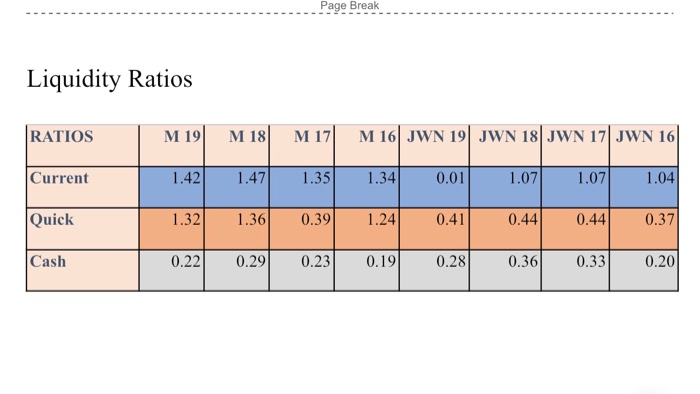
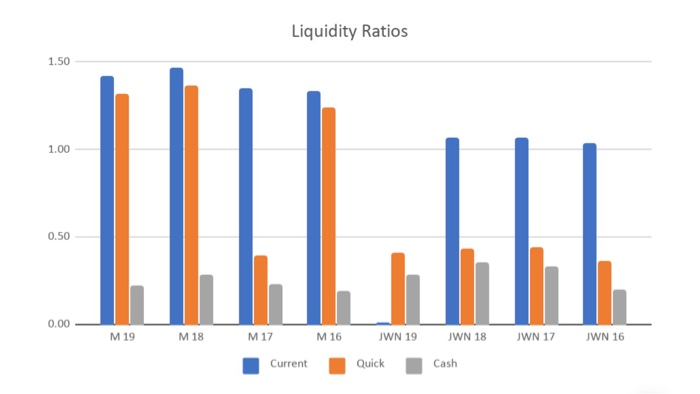
Cash Quick Leeo gco sro oro ero 670 220 LEO ro ro ito tri 660 ET EL to'l Lol Loi 100 ter sei Lt vi 91 NMP 21 NMC |81 NMP (61 NMC (91W LIW 81 | W | Current RATIOS Liquidity Ratios Page Break Liquidity Ratios 1.50 1.00 0.50 0.00 - M 19 M 18 M17 M16 JWN 19 JWN 18 WN 17 JWN 16 Current Quick Cash
Step by Step Solution
There are 3 Steps involved in it
1 Expert Approved Answer
Step: 1 Unlock

Question Has Been Solved by an Expert!
Get step-by-step solutions from verified subject matter experts
Step: 2 Unlock
Step: 3 Unlock