

Question: How would you interpret and compare the data from the table and bar graph from Company M and Company JWN? Keep the following questions in
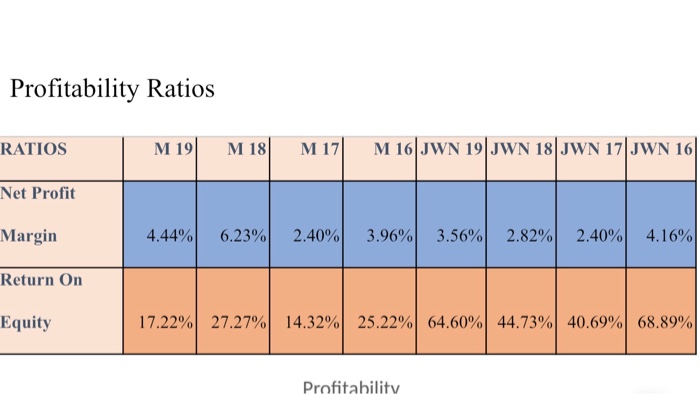
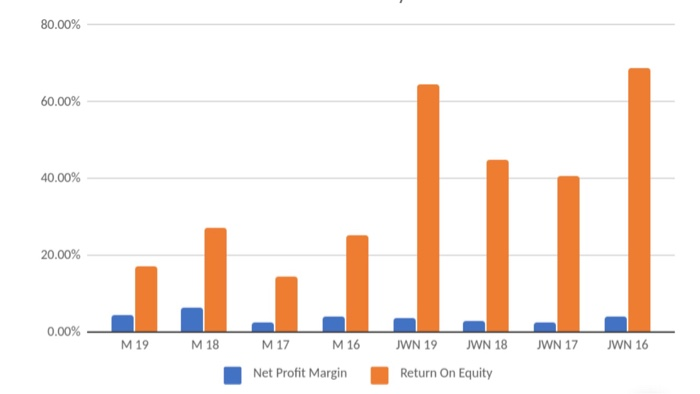
Profitability Ratios RATIOS M 19 M 18 M 17 M 16 JWN 19 JWN 18|JWN 17|JWN 16 Net Profit Margin 4.44% 6.23% 2.40% 3.96% 3.56% 2.82% 2.40% 4.16% Return On Equity 17.22% 27.27% 14.32% 25.22% 64.60% 44.73% 40.69% 68.89% Profitability 80.00% 60.00% 40.00% 20.00% 0.00% M19 M 18 M17 M16 JWN 19 JWN 18 JWN 17 JWN 16 Net Profit Margin Return On Equity Profitability Ratios RATIOS M 19 M 18 M 17 M 16 JWN 19 JWN 18|JWN 17|JWN 16 Net Profit Margin 4.44% 6.23% 2.40% 3.96% 3.56% 2.82% 2.40% 4.16% Return On Equity 17.22% 27.27% 14.32% 25.22% 64.60% 44.73% 40.69% 68.89% Profitability 80.00% 60.00% 40.00% 20.00% 0.00% M19 M 18 M17 M16 JWN 19 JWN 18 JWN 17 JWN 16 Net Profit Margin Return On Equity
Step by Step Solution
There are 3 Steps involved in it

Get step-by-step solutions from verified subject matter experts