

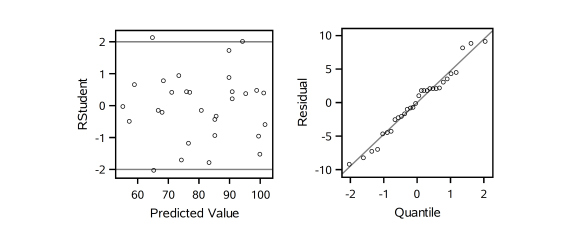
Question: {i}. [16 points] Consider the reduced model with only one ecn'lslariatorj.r variable HR [31}: y=n+1$1+ Fit the model to data and obtain the following output
![{i}. [16 points] Consider the reduced model with only one ecn'lslariatorj.r](https://s3.amazonaws.com/si.experts.images/answers/2024/06/6678498a02010_17766784989d8453.jpg)

![28 513553626 165. 19TH] Corrected Total 29 63121666? Rt MSE 13.66374 H-S-quare](https://s3.amazonaws.com/si.experts.images/answers/2024/06/6678498c048fc_1796678498be7e50.jpg)


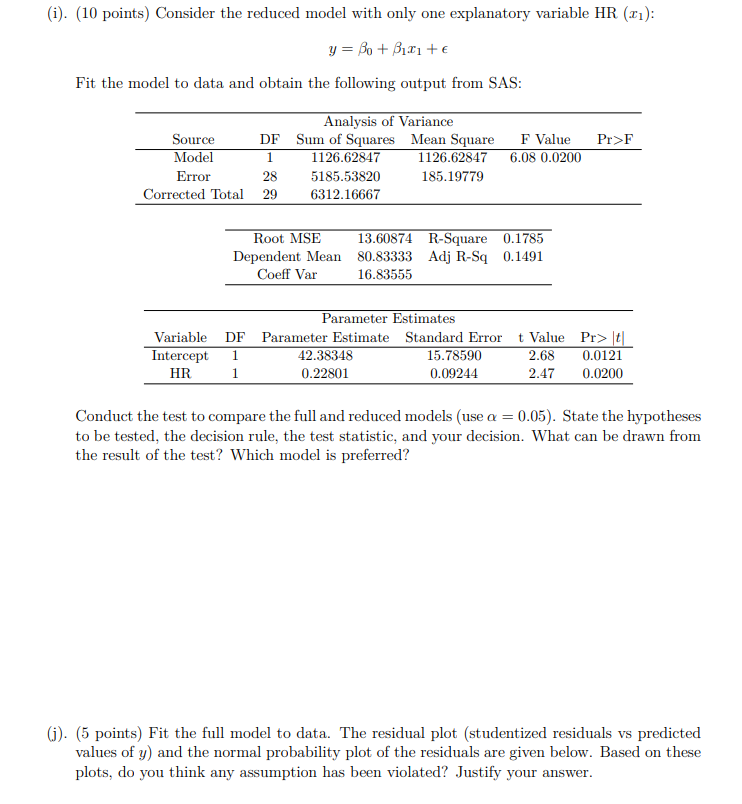
{i}. [16 points] Consider the reduced model with only one ecn'lslariatorj.r variable HR [31}: y=n+1$1+ Fit the model to data and obtain the following output from 3113: Analysis of Variance Source DF Sum of Squares Mean Square F 1tiralue Pr}F Model 1 11266264? 11266264? 6.66 6.6266 Error 28 513553626 165. 19TH] Corrected Total 29 63121666? Rt MSE 13.66374 H-S-quare 6.1T35 Dependent Mean 66.63333 Adj RSq 6.14191 Goat? Var 16.33555 Parameter Estimates Variable DF Parameter Estimate Standard Error t 1afalue Pr} 1 Intercept 1 42.38346 15.?6596 2.66 6.6121 HR 1 6.22661 6.66244 2.47 6.6266 Conduct the test to compare the full and reduced models [use or = 6.65}. State the hypotheses to he tested. the decision rule, the test statistic. and your decision. 1What can be drawn from the result of the test? 'Which model is preferred? {j}. {5 points} Fit the full model to data. The residual plot [student-iced residuals vs predicted values of y} and the normal 1;:mhahilitjyr plot of the residuals are given below. Based on these plots, do you think an}.r assumption has been violated? Justifyr your answer. \f2 10 1 5 O I+ RStudent 0 - Residual 0 0 -1 - -5 -2 -10 60 70 80 90 100 -2 -1 0 2 Predicted Value Quantile
Step by Step Solution
There are 3 Steps involved in it

Get step-by-step solutions from verified subject matter experts