

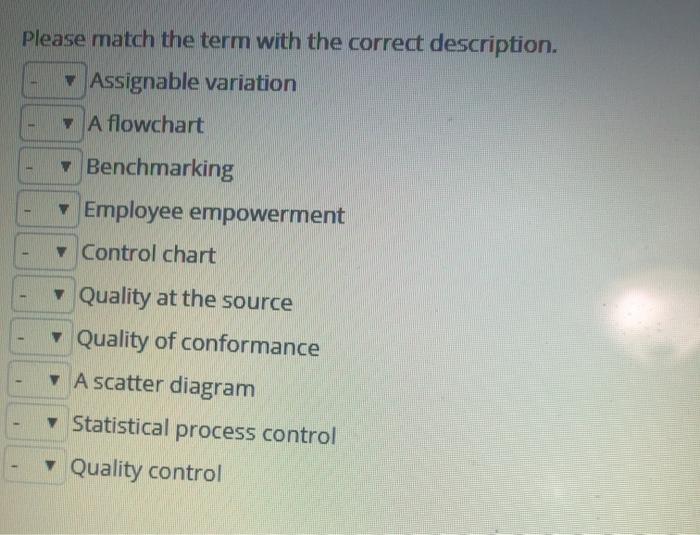
Question: i am having trouble with specific terms * Assignable variation A flowchart Benchmarking Employee empowerment 1 - Control chart 1 + Quality at the source
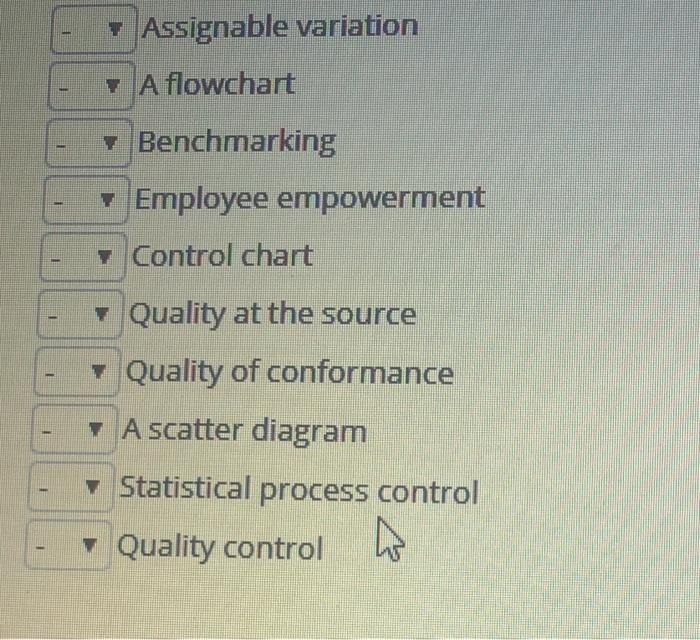
i am having trouble with specific terms
Step by Step Solution
There are 3 Steps involved in it
1 Expert Approved Answer
Step: 1 Unlock

Question Has Been Solved by an Expert!
Get step-by-step solutions from verified subject matter experts
Step: 2 Unlock
Step: 3 Unlock