

Question: I am stuck on this problem. Mostly on part 2. You will need the two.csv files below. They both include data over the same period
I am stuck on this problem. Mostly on part 2.
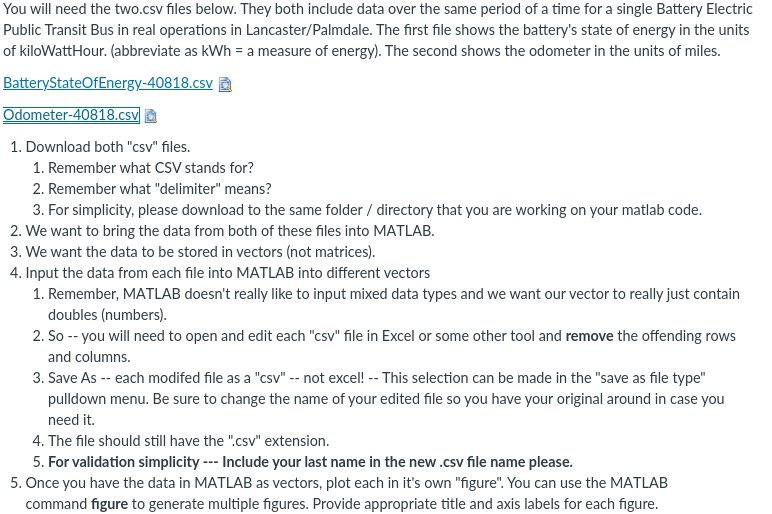
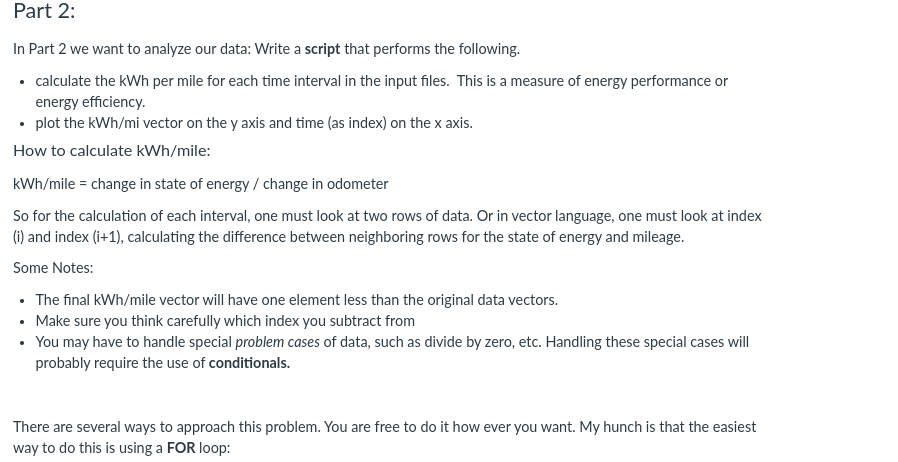
You will need the two.csv files below. They both include data over the same period of a time for a single Battery Electric Public Transit Bus in real operations in Lancaster/Palmdale. The first file shows the battery's state of energy in the units of kiloWatt Hour. (abbreviate as kWh = a measure of energy). The second shows the odometer in the units of miles. BatteryStateOfEnergy-40818.csv Odometer-40818.csv 1. Download both "csv" files. 1. Remember what CSV stands for? 2. Remember what "delimiter" means? 3. For simplicity, please download to the same folder / directory that you are working on your matlab code. 2. We want to bring the data from both of these files into MATLAB. 3. We want the data to be stored in vectors (not matrices). 4. Input the data from each file into MATLAB into different vectors 1. Remember, MATLAB doesn't really like to input mixed data types and we want our vector to really just contain doubles (numbers). 2. So -- you will need to open and edit each "csv" file in Excel or some other tool and remove the offending rows and columns. 3. Save As -- each modifed file as a "csv" -- not excel! -- This selection can be made in the "save as file type" pulldown menu. Be sure to change the name of your edited file so you have your original around in case you need it. 4. The file should still have the ".csv" extension. 5. For validation simplicity --- Include your last name in the new.csv file name please. 5. Once you have the data in MATLAB as vectors, plot each in it's own "figure". You can use the MATLAB command figure to generate multiple figures. Provide appropriate title and axis labels for each figure. Part 2: In Part 2 we want to analyze our data: Write a script that performs the following. calculate the kWh per mile for each time interval in the input files. This is a measure of energy performance or energy efficiency. plot the kWh/mi vector on the y axis and time (as index) on the x axis. How to calculate kWh/mile: kWh/mile = change in state of energy / change in odometer So for the calculation of each interval, one must look at two rows of data. Or in vector language, one must look at index (i) and index (i+1), calculating the difference between neighboring rows for the state of energy and mileage. Some Notes: The final kWh/mile vector will have one element less than the original data vectors. Make sure you think carefully which index you subtract from You may have to handle special problem cases of data, such as divide by zero, etc. Handling these special cases will probably require the use of conditionals. There are several ways to approach this problem. You are free to do it how ever you want. My hunch is that the easiest way to do this is using a FOR loop: You will need the two.csv files below. They both include data over the same period of a time for a single Battery Electric Public Transit Bus in real operations in Lancaster/Palmdale. The first file shows the battery's state of energy in the units of kiloWatt Hour. (abbreviate as kWh = a measure of energy). The second shows the odometer in the units of miles. BatteryStateOfEnergy-40818.csv Odometer-40818.csv 1. Download both "csv" files. 1. Remember what CSV stands for? 2. Remember what "delimiter" means? 3. For simplicity, please download to the same folder / directory that you are working on your matlab code. 2. We want to bring the data from both of these files into MATLAB. 3. We want the data to be stored in vectors (not matrices). 4. Input the data from each file into MATLAB into different vectors 1. Remember, MATLAB doesn't really like to input mixed data types and we want our vector to really just contain doubles (numbers). 2. So -- you will need to open and edit each "csv" file in Excel or some other tool and remove the offending rows and columns. 3. Save As -- each modifed file as a "csv" -- not excel! -- This selection can be made in the "save as file type" pulldown menu. Be sure to change the name of your edited file so you have your original around in case you need it. 4. The file should still have the ".csv" extension. 5. For validation simplicity --- Include your last name in the new.csv file name please. 5. Once you have the data in MATLAB as vectors, plot each in it's own "figure". You can use the MATLAB command figure to generate multiple figures. Provide appropriate title and axis labels for each figure. Part 2: In Part 2 we want to analyze our data: Write a script that performs the following. calculate the kWh per mile for each time interval in the input files. This is a measure of energy performance or energy efficiency. plot the kWh/mi vector on the y axis and time (as index) on the x axis. How to calculate kWh/mile: kWh/mile = change in state of energy / change in odometer So for the calculation of each interval, one must look at two rows of data. Or in vector language, one must look at index (i) and index (i+1), calculating the difference between neighboring rows for the state of energy and mileage. Some Notes: The final kWh/mile vector will have one element less than the original data vectors. Make sure you think carefully which index you subtract from You may have to handle special problem cases of data, such as divide by zero, etc. Handling these special cases will probably require the use of conditionals. There are several ways to approach this problem. You are free to do it how ever you want. My hunch is that the easiest way to do this is using a FOR loop
Step by Step Solution
There are 3 Steps involved in it

Get step-by-step solutions from verified subject matter experts