

Question: I attached the link for the excel sheet and the screenshot! Thank you! https://docs.google.com/spreadsheets/d/1kqYVys1XXMYVhBN__baU3m2XNoiGZrzbR7VBKjOcrzY/edit?usp=sharing A B C D E F G H J K L
I attached the link for the excel sheet and the screenshot! Thank you!
https://docs.google.com/spreadsheets/d/1kqYVys1XXMYVhBN__baU3m2XNoiGZrzbR7VBKjOcrzY/edit?usp=sharing
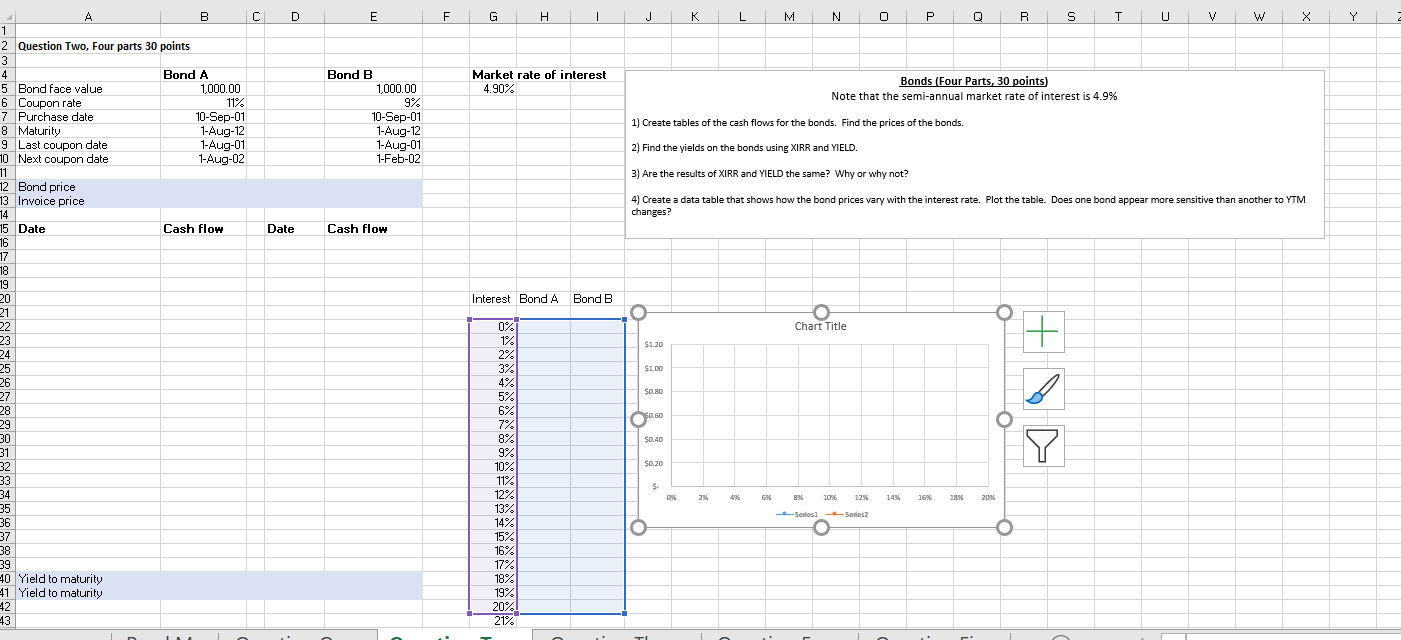
A B C D E F G H J K L M N 0 P Q R S T U V W X Y Question Two, Four parts 30 points Bond A Bond B Market rate of interest 5 Bond face value 1,000.00 1.000.00 4.90% Bonds (Four Parts, 30 points) 6 Coupon rate 11% 9% Note that the semi-annual market rate of interest is 4.9% Purchase date 10-Sep-01 10-Sep-01 8 Maturity 1-Aug-12 1-Aug-12 1) Create tables of the cash flows for the bonds. Find the prices of the bonds. 9 Last coupon date 1-Aug-01 1-Aug-01 2) Find the yields on the bonds using XIRR and YIELD. Next coupon date 1-Aug-02 1-Feb-02 3) Are the results of XIRR and YIELD the same? Why or why not? Bond price Invoice price 4) Create a data table that shows how the bond prices vary with the interest rate. Plot the table. Does one bond appear more sensitive than another to YTM changes? 15 Date Cash flow Date Cash flow Interest Bond A Bond B O O 0% Chart Title 1% $1.20 2% 3% $1.00 5% SO.8D 6% 7% O 8% $0.40 9% Y 10% $0.20 11% 12% 2%% 4% 8% 10% 12% 14% 16 185% 20%% 13% *Series1 -Seriesz 14% O 15% 16% 17% 40 Yield to maturity 18% 11 Yield to maturity 19% 12 20% 43 21%
Step by Step Solution
There are 3 Steps involved in it

Get step-by-step solutions from verified subject matter experts