

Question: I need e, f, g only Question 4 continued (e) Use the 1H13C HMBC NMR spectrum to complete the following table of proton chemical shifts
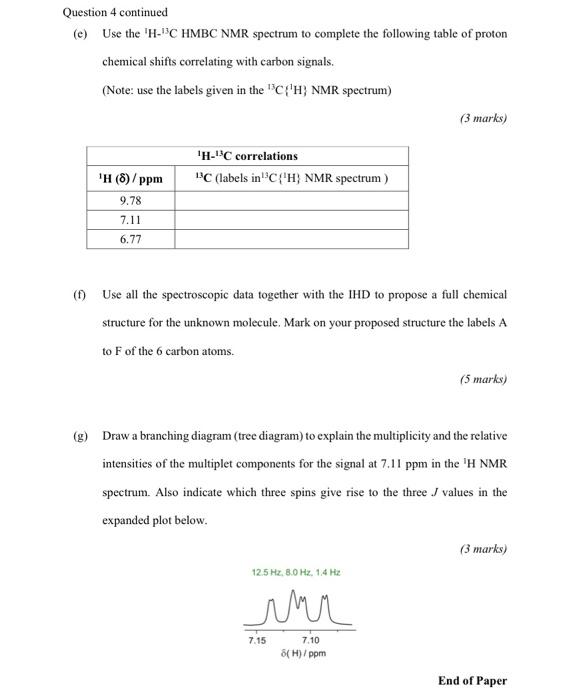
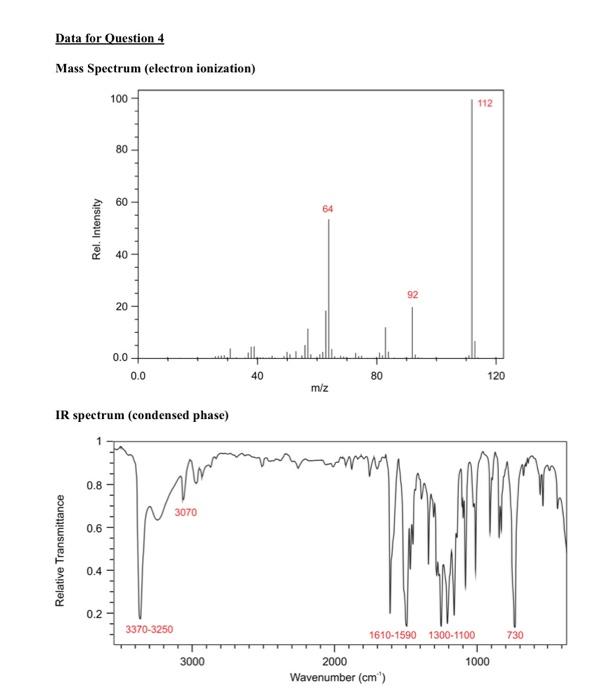
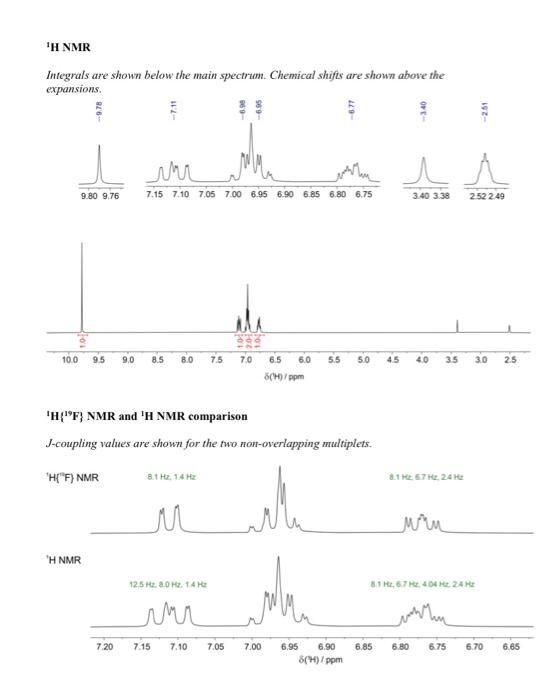
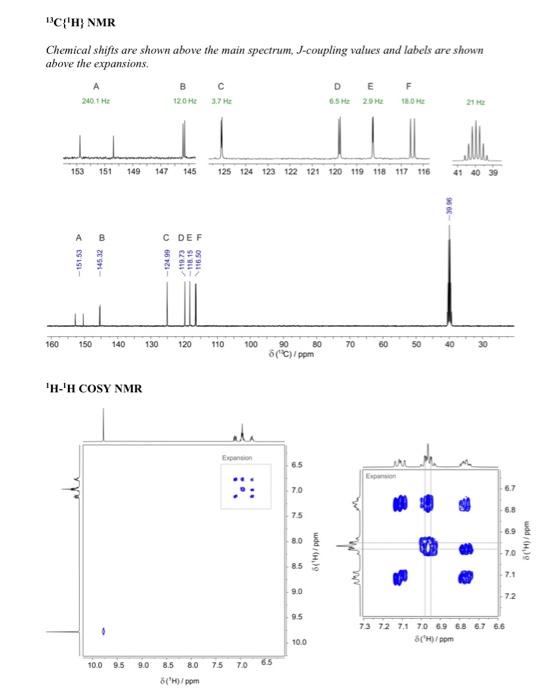
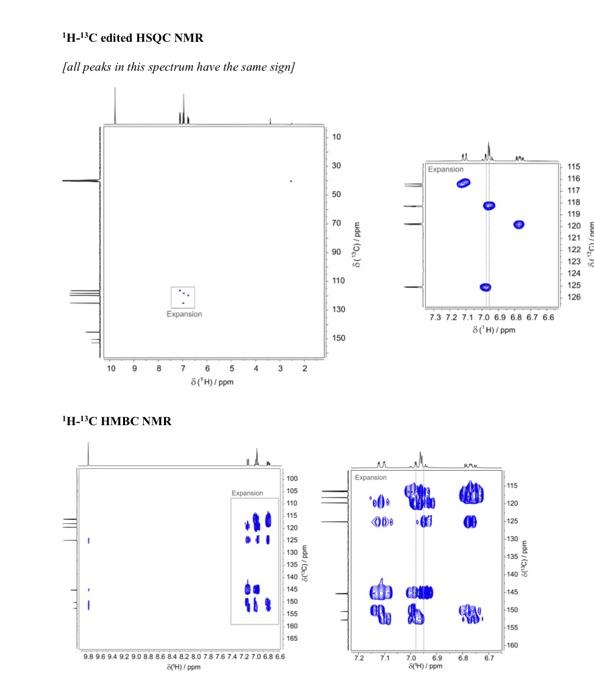
Question 4 continued (e) Use the 1H13C HMBC NMR spectrum to complete the following table of proton chemical shifts correlating with carbon signals. (Note: use the labels given in the 13C{1H} NMR spectrum) (3 marks) (f) Use all the spectroscopic data together with the IHD to propose a full chemical structure for the unknown molecule. Mark on your proposed structure the labels A to F of the 6 carbon atoms. (5 marks) (g) Draw a branching diagram (tree diagram) to explain the multiplicity and the relative intensities of the multiplet components for the signal at 7.11ppm in the 1H NMR spectrum. Also indicate which three spins give rise to the three J values in the expanded plot below. (3 marks) End of Paper Data for Question 4 Mass Spectrum (electron ionization) IR spectrum (condensed phase) 1H NMR Integrals are shown below the main spectrum. Chemical shifts are shown above the 1H{19F} NMR and 1H NMR comparison J-coupling values are shown for the two non-overlapping multiplets. 13C{1H} NMR Chemical shifts are shown above the main spectrum, J-coupling values and labels are shown above the expansions. 1H1H COSY NMR 1H13C edited HSQC NMR [all peaks in this spectrum have the same sign] Question 4 continued (e) Use the 1H13C HMBC NMR spectrum to complete the following table of proton chemical shifts correlating with carbon signals. (Note: use the labels given in the 13C{1H} NMR spectrum) (3 marks) (f) Use all the spectroscopic data together with the IHD to propose a full chemical structure for the unknown molecule. Mark on your proposed structure the labels A to F of the 6 carbon atoms. (5 marks) (g) Draw a branching diagram (tree diagram) to explain the multiplicity and the relative intensities of the multiplet components for the signal at 7.11ppm in the 1H NMR spectrum. Also indicate which three spins give rise to the three J values in the expanded plot below. (3 marks) End of Paper Data for Question 4 Mass Spectrum (electron ionization) IR spectrum (condensed phase) 1H NMR Integrals are shown below the main spectrum. Chemical shifts are shown above the 1H{19F} NMR and 1H NMR comparison J-coupling values are shown for the two non-overlapping multiplets. 13C{1H} NMR Chemical shifts are shown above the main spectrum, J-coupling values and labels are shown above the expansions. 1H1H COSY NMR 1H13C edited HSQC NMR [all peaks in this spectrum have the same sign]
Step by Step Solution
There are 3 Steps involved in it

Get step-by-step solutions from verified subject matter experts