

Question: I need help building this in EXCEL Here is the data and the cause and effect diagram needs to be about the galley servicing delay
I need help building this in EXCEL Here is the data and the cause and effect diagram needs to be about the galley servicing delay and I need 4 categories and causes for it, please. I'm having a hard time building it.
Build a Cause-and-Effect Diagram
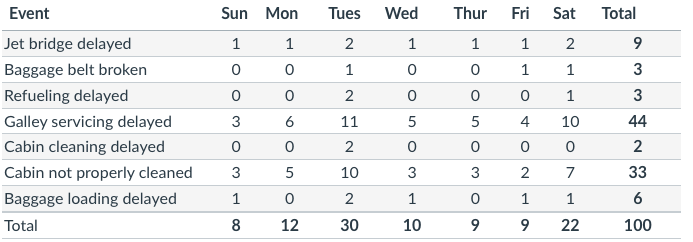
Now that you have run the data, lets look a little deeper and try to determine the possible causes of the problems. Galley servicing delays showed the highest number of problems on our original check sheet, so think about possible issues with galley servicing and produce a cause-and-effect diagram (also known as a fishbone or Ishikawa diagram). Use as least 4 categories and think of several causes for each of the categories.
\begin{tabular}{lcccccccc} Event & Sun & Mon & Tues & Wed & Thur & Fri & Sat & Total \\ \hline Jet bridge delayed & 1 & 1 & 2 & 1 & 1 & 1 & 2 & 9 \\ \hline Baggage belt broken & 0 & 0 & 1 & 0 & 0 & 1 & 1 & 3 \\ \hline Refueling delayed & 0 & 0 & 2 & 0 & 0 & 0 & 1 & 3 \\ \hline Galley servicing delayed & 3 & 6 & 11 & 5 & 5 & 4 & 10 & 44 \\ \hline Cabin cleaning delayed & 0 & 0 & 2 & 0 & 0 & 0 & 0 & 2 \\ \hline Cabin not properly cleaned & 3 & 5 & 10 & 3 & 3 & 2 & 7 & 33 \\ \hline Baggage loading delayed & 1 & 0 & 2 & 1 & 0 & 1 & 1 & 6 \\ \hline Total & 8 & 12 & 30 & 10 & 9 & 9 & 22 & 100 \\ \hline \end{tabular}Step by Step Solution
There are 3 Steps involved in it

Get step-by-step solutions from verified subject matter experts