

Question: I need help doing this in python. The first file (main.py) is the one i can edit and the other where the heaveside function is,
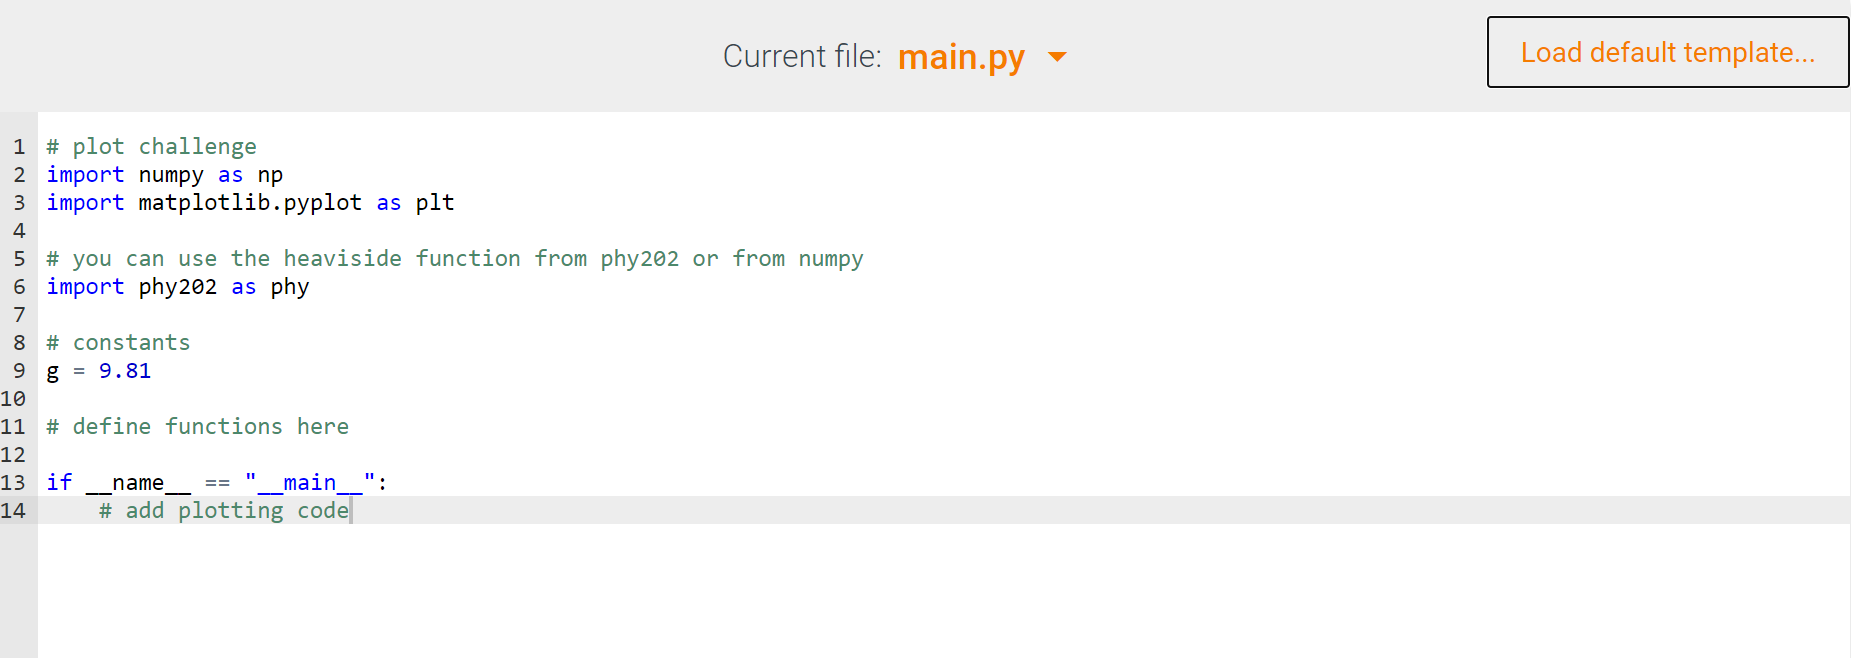
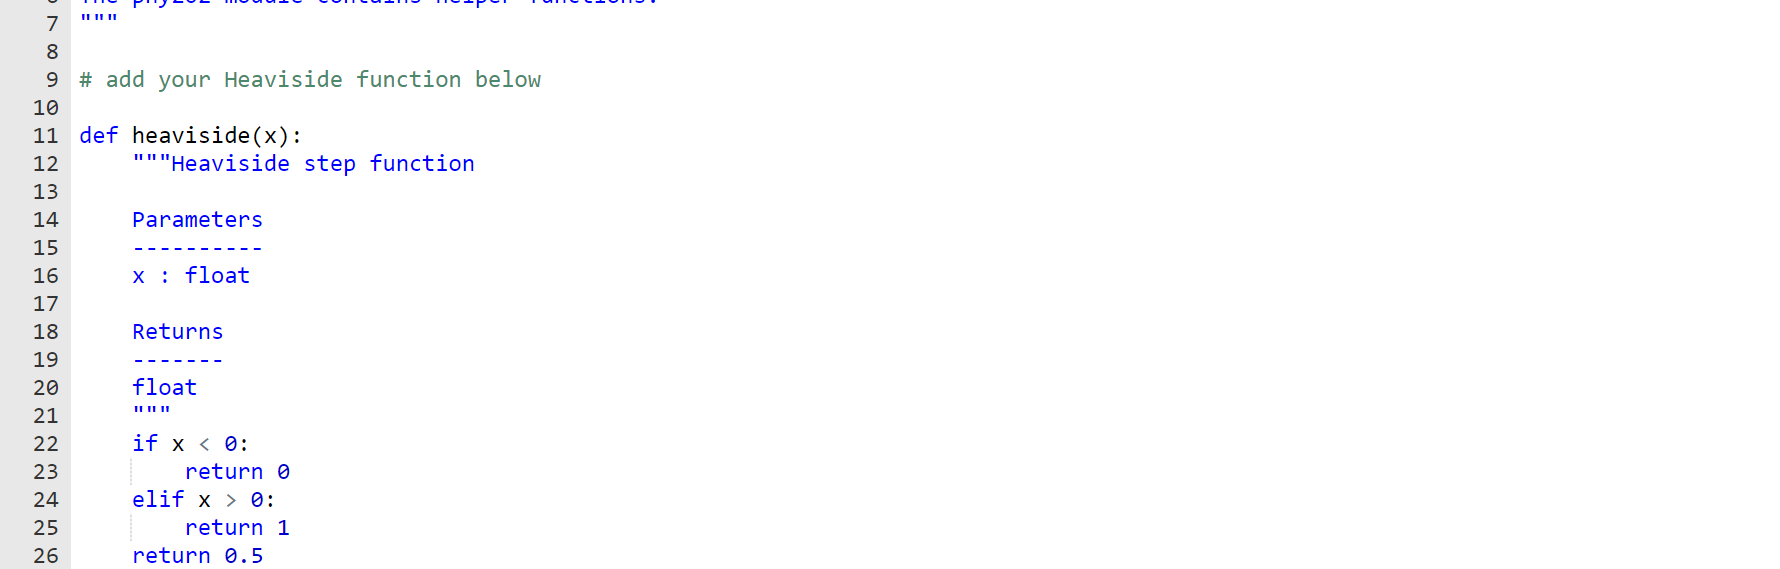
I need help doing this in python. The first file (main.py) is the one i can edit and the other where the heaveside function is, im suppose to call to and cannot edit that file.
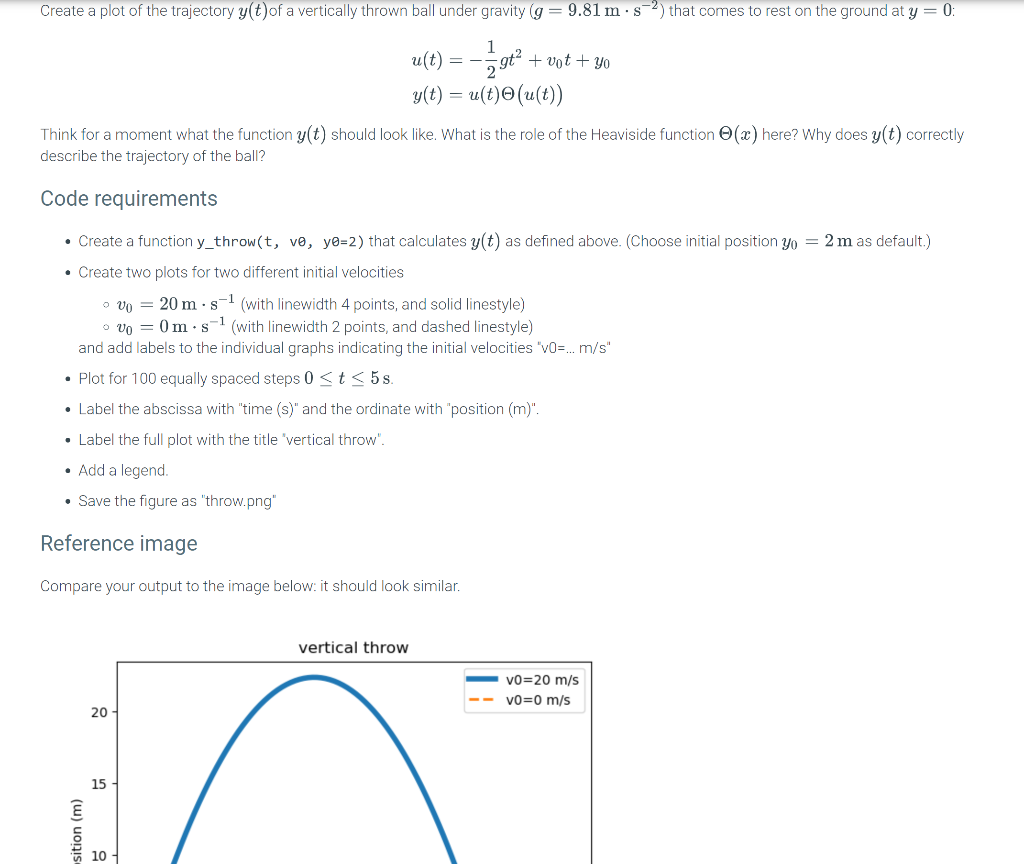
Create a plot of the trajectory y(t)of a vertically thrown ball under gravity (g = 9.81 m.s that comes to rest on the ground at y = 0; u(t) = -59 + vot + yo y(t) = u(t)(u(t)) Think for a moment what the function y(t) should look like. What is the role of the Heaviside function (x) here? Why does y(t) correctly describe the trajectory of the ball? Code requirements Create a function y_throw(t, vo, yo=2) that calculates y(t) as defined above. (Choose initial position yo = 2 m as default.) Create two plots for two different initial velocities Vo = 20 m.s-1 (with linewidth 4 points, and solid linestyle) Vo = 0m.s-1 (with linewidth 2 points, and dashed linestyle) and add labels to the individual graphs indicating the initial velocities "VO=... m/s" Plot for 100 equally spaced steps 0
Step by Step Solution
There are 3 Steps involved in it

Get step-by-step solutions from verified subject matter experts