

Question: I need help graphing and writing the equation. Graphs: Position vs time ded vanud gallond Buggy 1: Blue Buggy 2: 100 1007 Pastion POISition cems
I need help graphing and writing the equation.
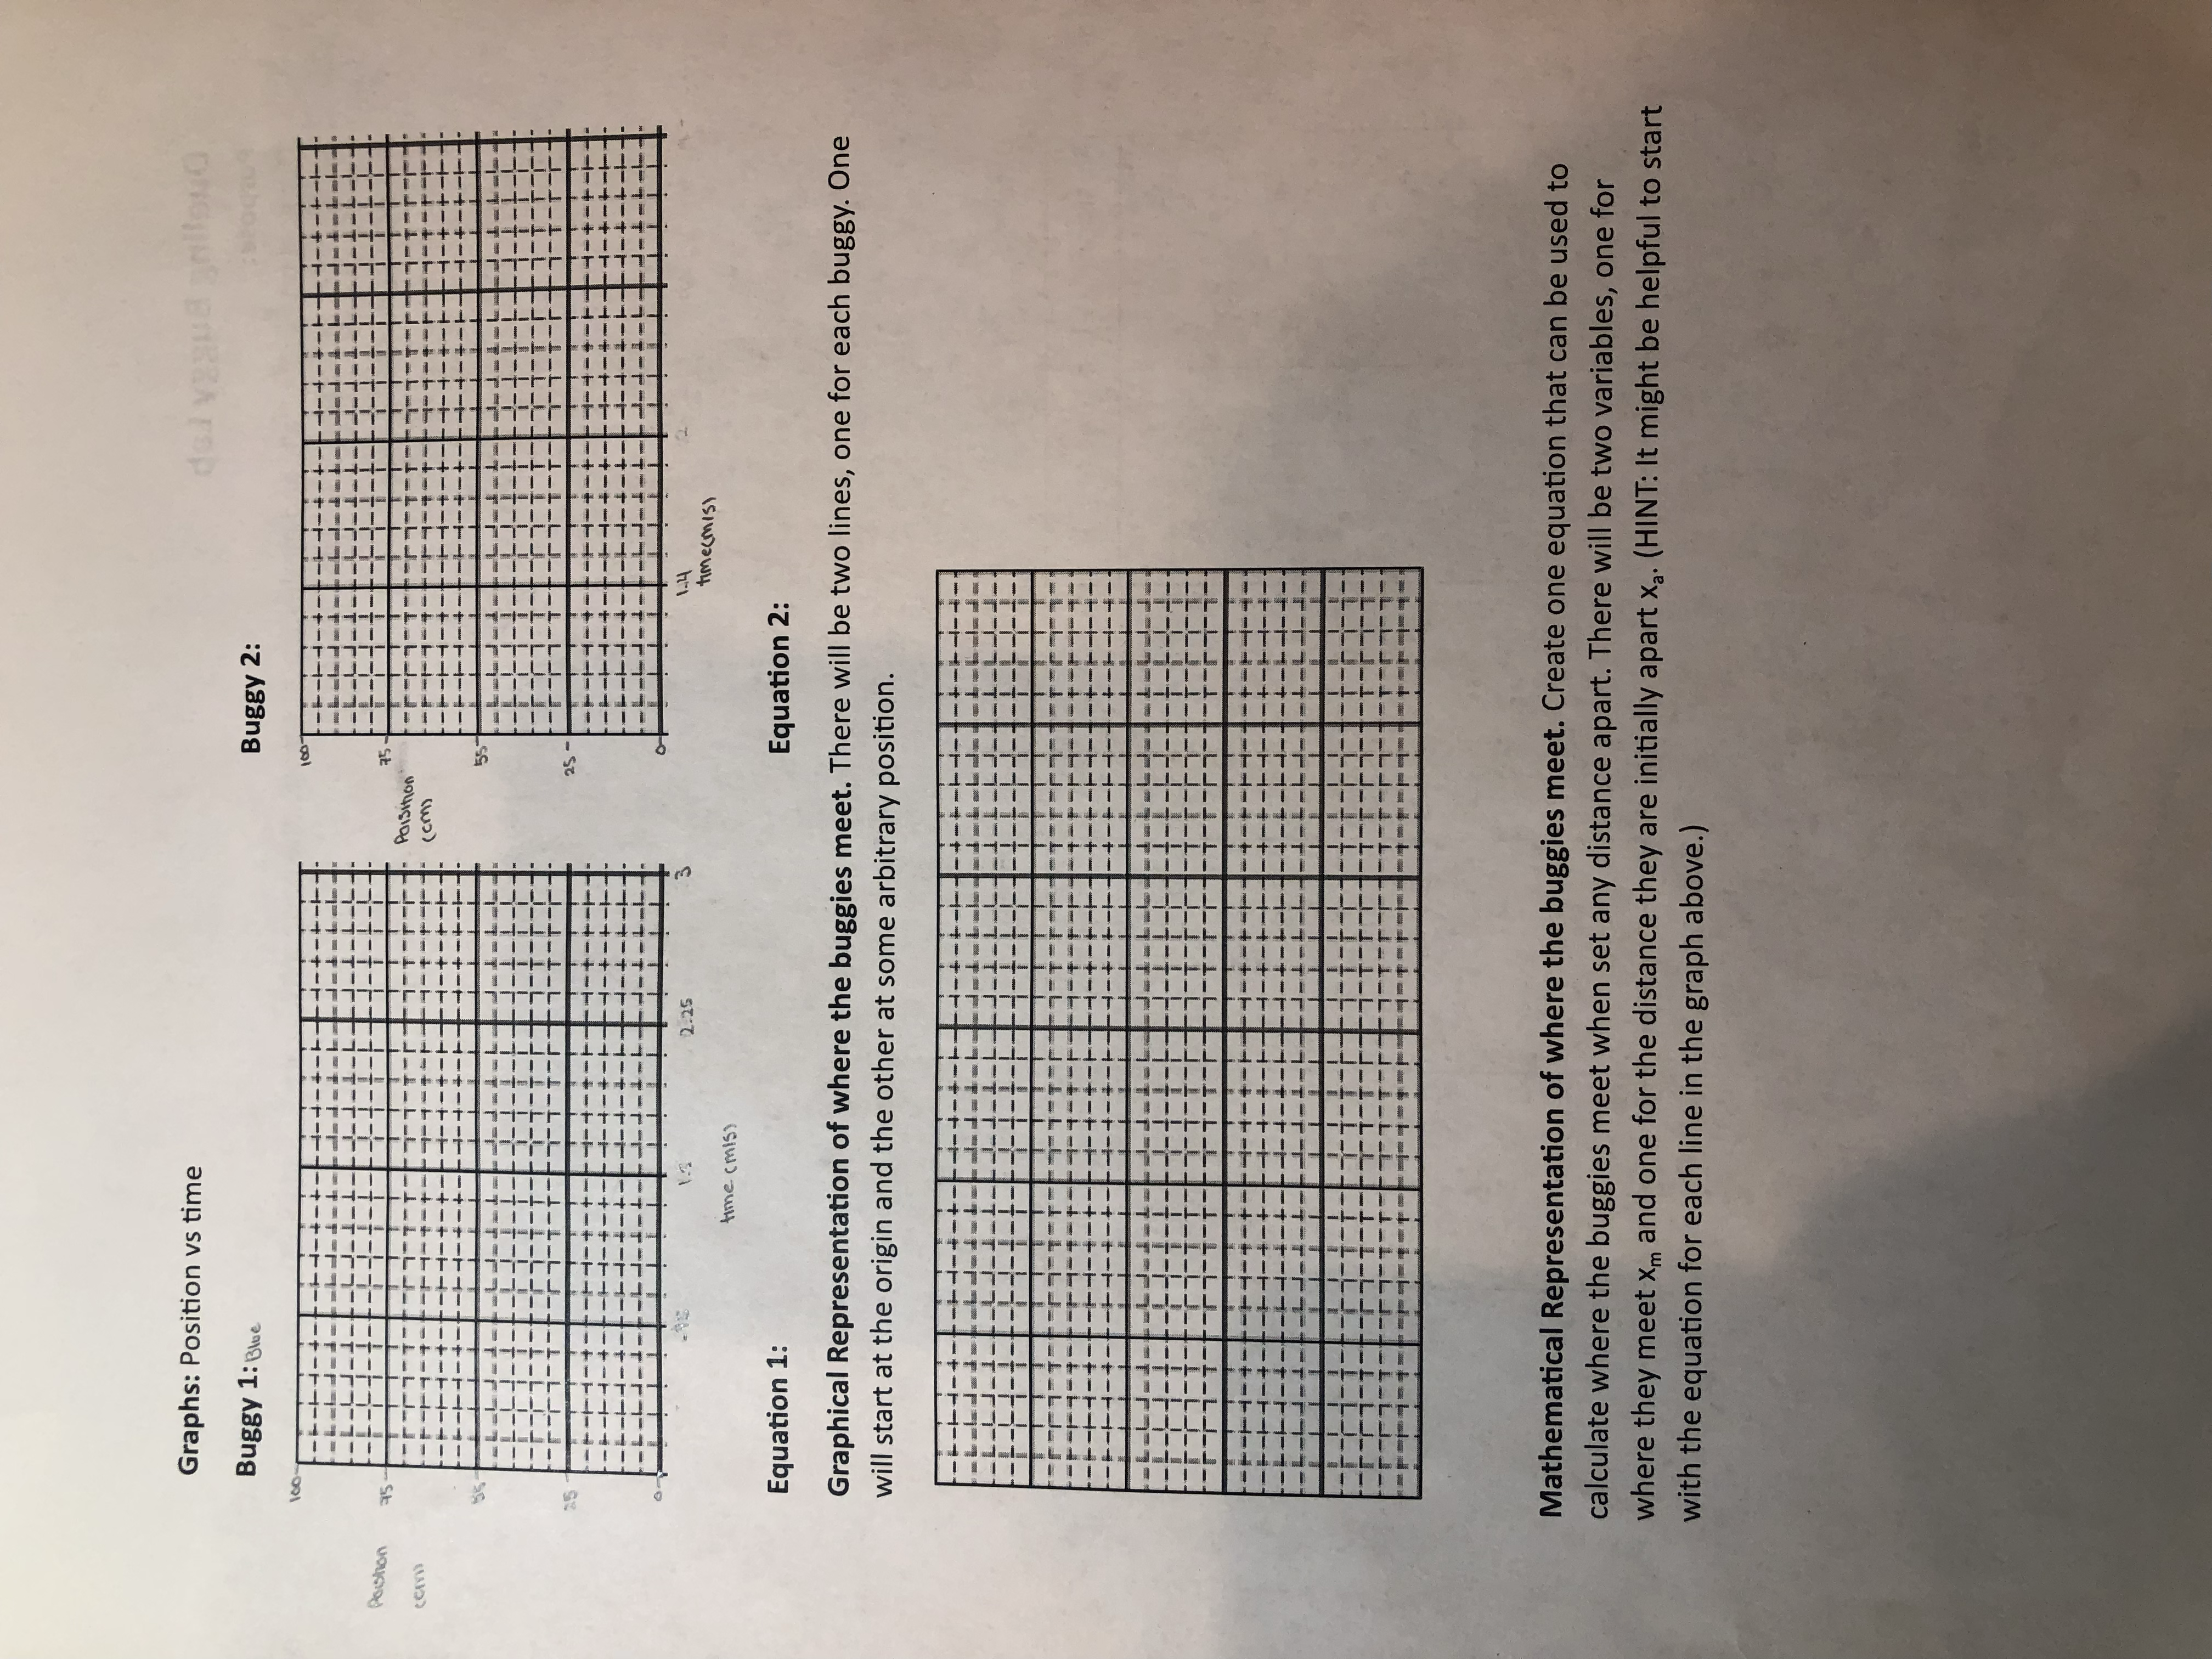
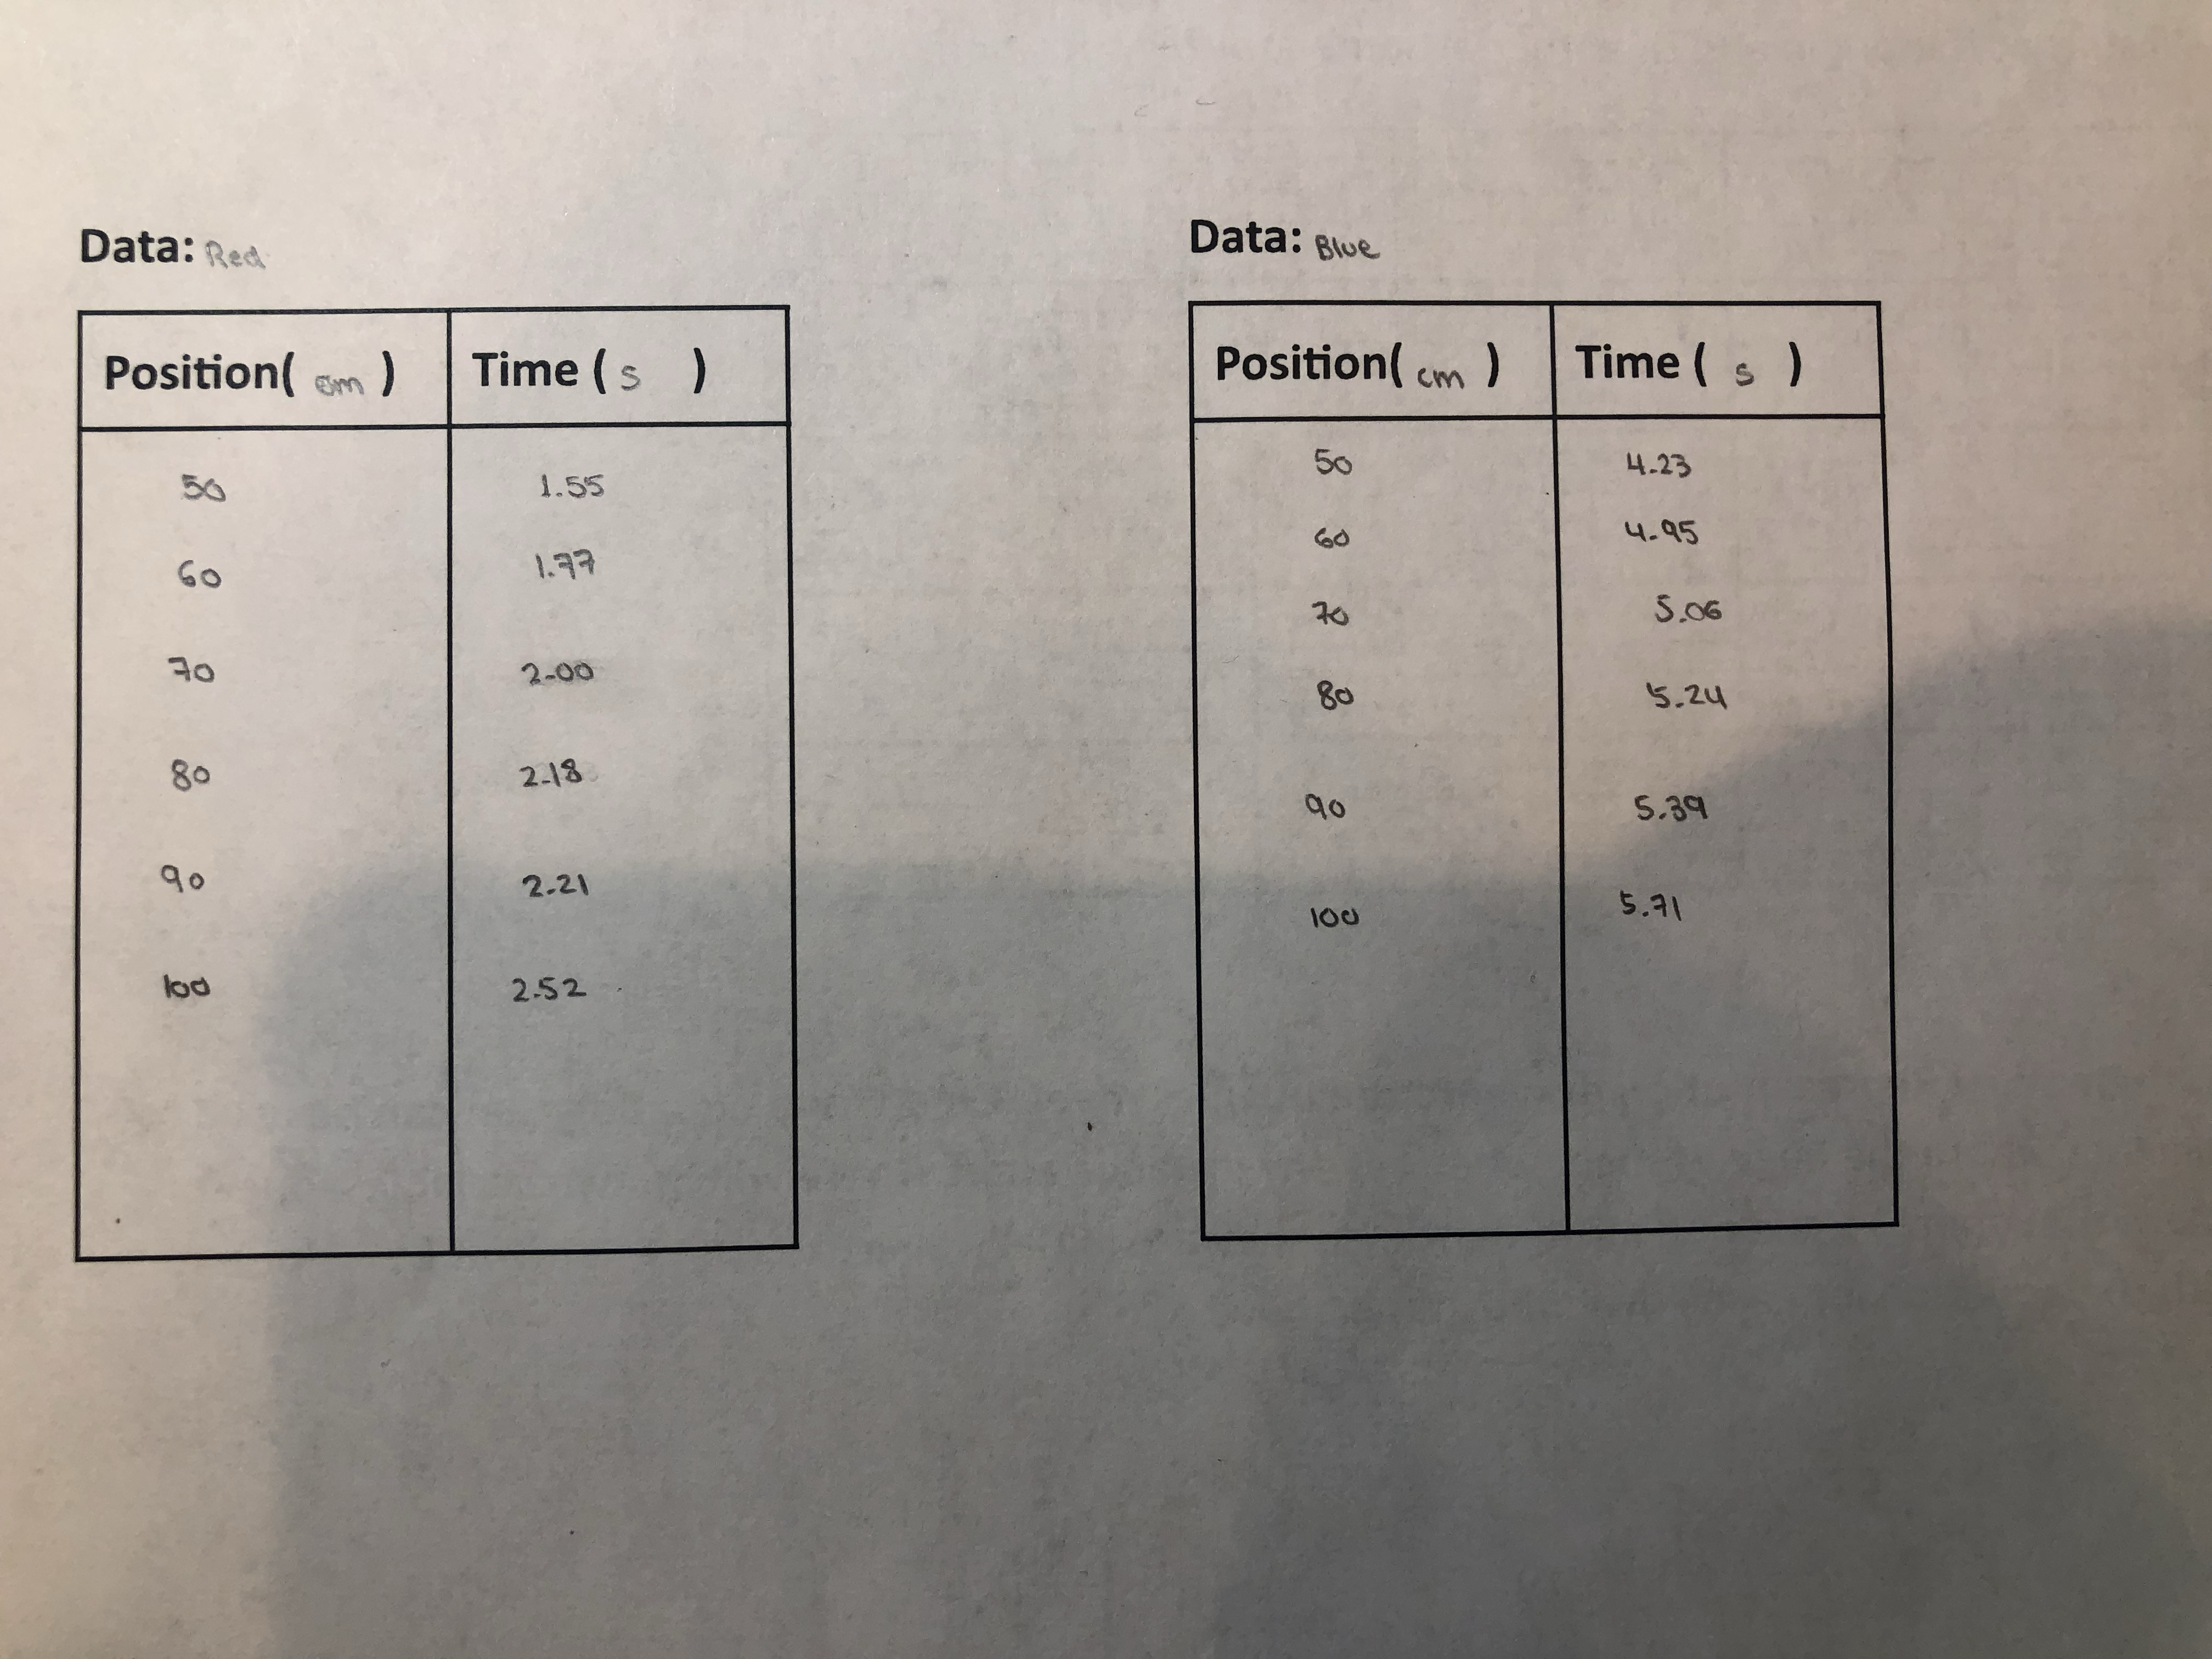
Graphs: Position vs time ded vanud gallond Buggy 1: Blue Buggy 2: 100 1007 Pastion POISition cems (cmy 25- 2.25 1.4 time (miss time (miss Equation 1: Equation 2: Graphical Representation of where the buggies meet. There will be two lines, one for each buggy. One will start at the origin and the other at some arbitrary position. Mathematical Representation of where the buggies meet. Create one equation that can be used to calculate where the buggies meet when set any distance apart. There will be two variables, one for where they meet Xm and one for the distance they are initially apart X2. (HINT: It might be helpful to start with the equation for each line in the graph above.)Data: Blue Data: Red Position( om ) Time ( s ) Position( cm ) Time ( s ) 50 4-23 50 1.55 60 4-95 60 1.97 70 5.06 70 2-00 80 5.24 80 2-18 go 5.39 90 2-21 10 0 5.71 lod 2.52
Step by Step Solution
There are 3 Steps involved in it

Get step-by-step solutions from verified subject matter experts