

Question: I need help on the results section for my research paper. All graphs need a legends and results clearly described with reference to statistics and
I need help on the results section for my research paper. All graphs need a legends and results clearly described with reference to statistics and figures/tables. I also need help on the discussion section. Instructions are In Results are discussed in depth and Comparisons to published literature present for all results.
Below are the graphs:
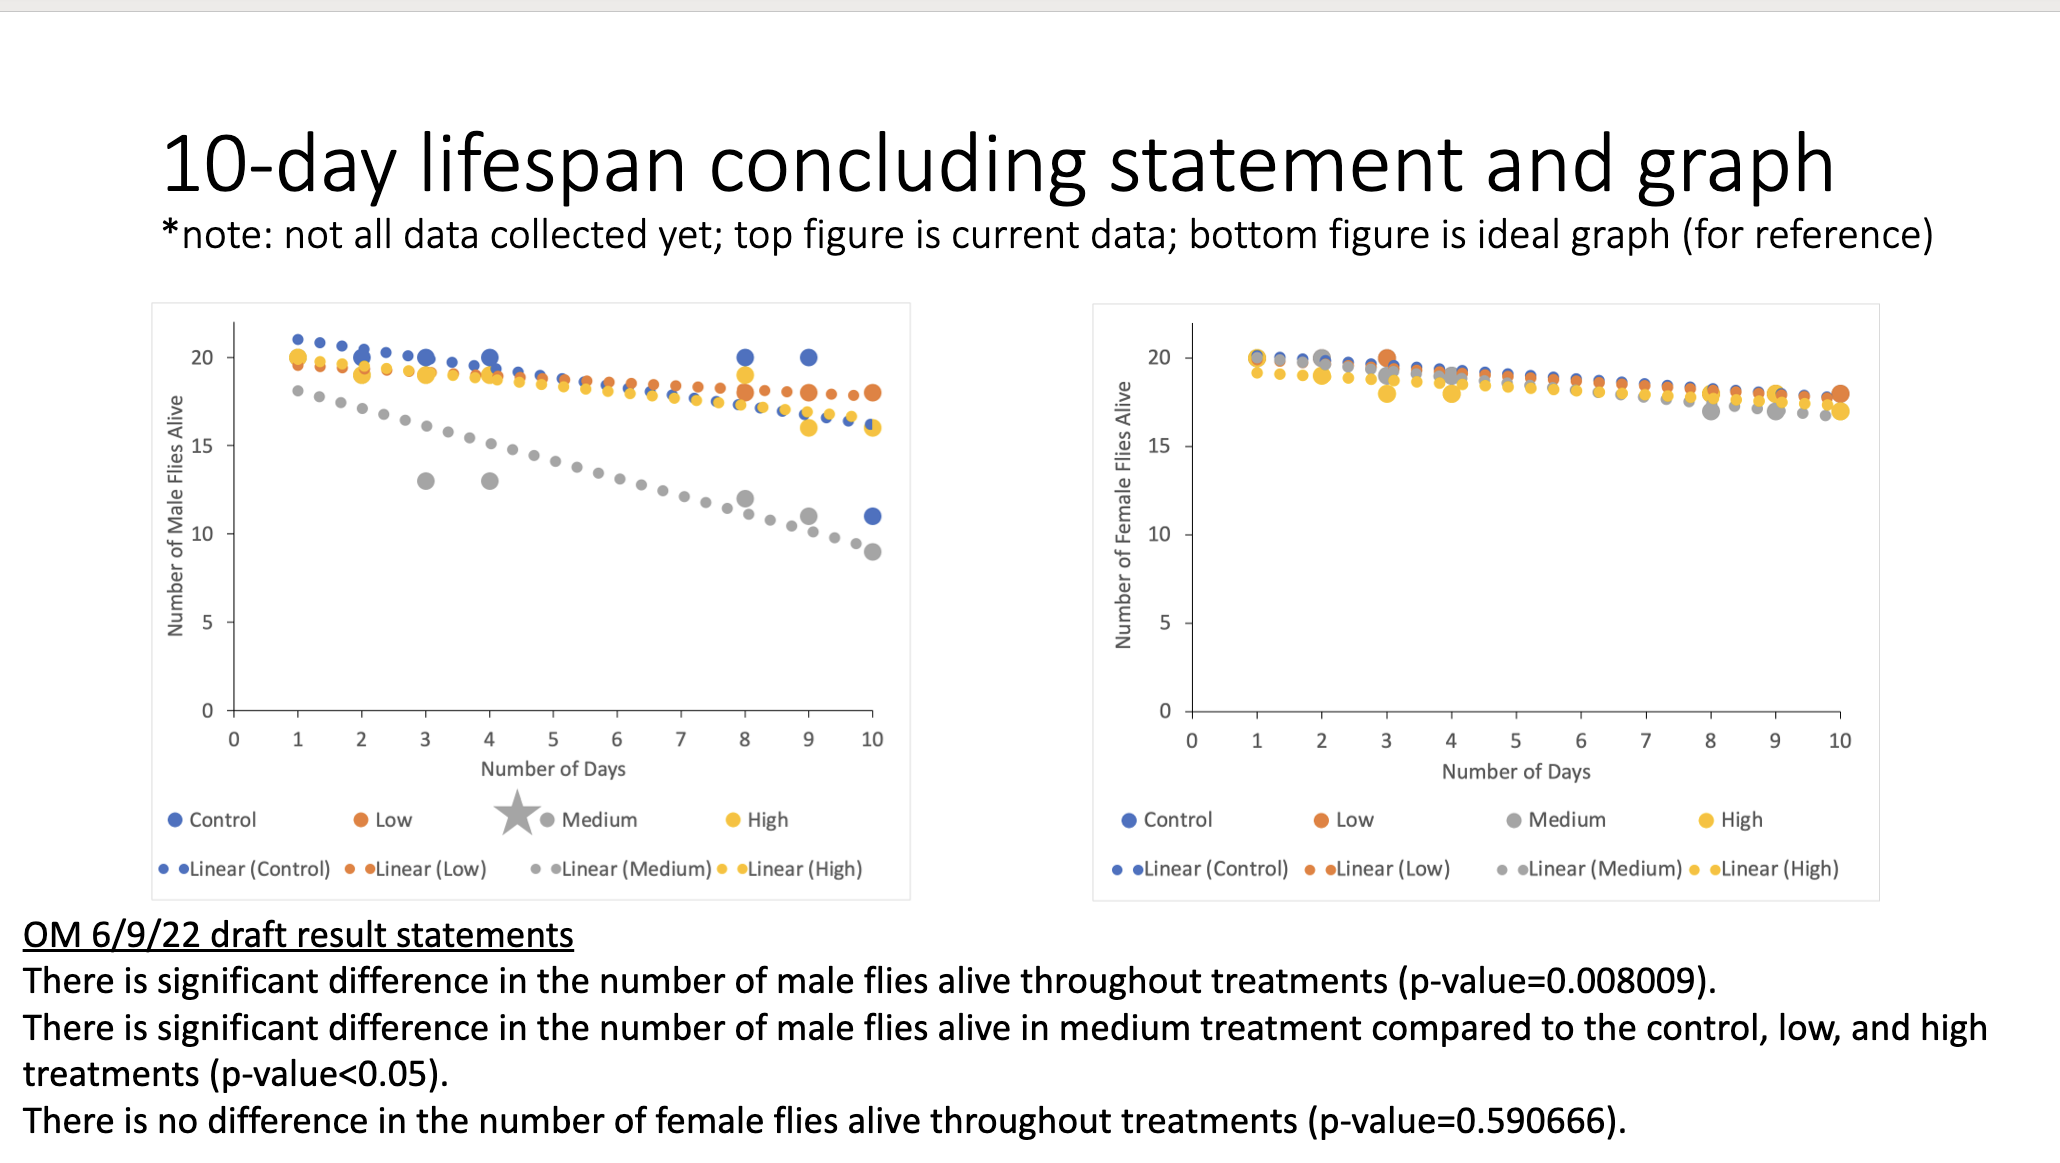
10-day lifespan concluding statement and graph *note: not all data collected yet; top figure is current data; bottom figure is ideal graph (for reference) 20 20 8 ::8 : . . . . . .... . 15 . . . 15 . . . . Number of Female Flies Alive Number of Male Flies Alive 10 . . . 10 5 5 0 0 0 1 2 3 5 6 7 8 9 10 0 2 3 4 5 6 7 8 9 10 Number of Days Number of Days . Control . Low . Medium . High Control . Low . Medium . High . .Linear (Control) . .Linear (Low) . .Linear (Medium) . .Linear (High) . .Linear (Control) . .Linear (Low) . .Linear (Medium) . .Linear (High) OM 6/9/22 draft result statements There is significant difference in the number of male flies alive throughout treatments (p-value=0.008009). There is significant difference in the number of male flies alive in medium treatment compared to the control, low, and high treatments (p-value
Step by Step Solution
There are 3 Steps involved in it

Get step-by-step solutions from verified subject matter experts