

Question: I need help with my statistics homework please Increase in Life Expectancy in the United States during the 20th Century Expected Expected Year Life Span

I need help with my statistics homework please
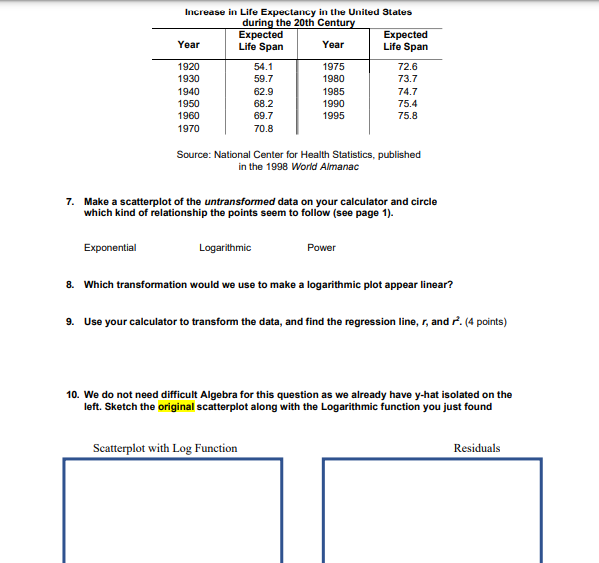
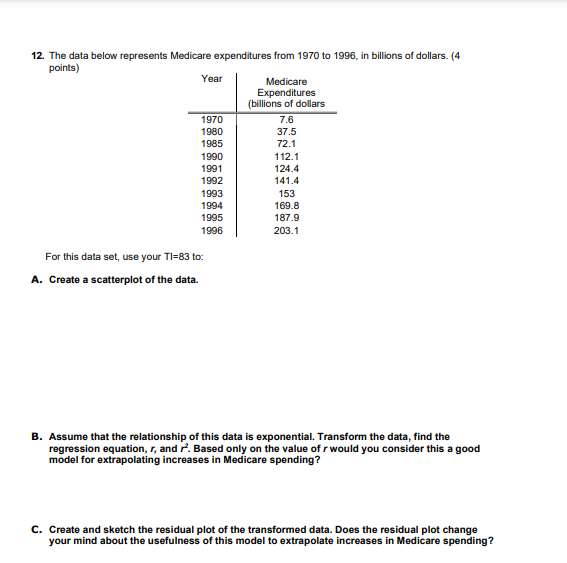
Increase in Life Expectancy in the United States during the 20th Century Expected Expected Year Life Span Year Life Span 1920 54.1 1975 72.6 1930 59.7 1980 73.7 1940 62.9 1985 74.7 1950 68.2 1990 75.4 1960 69.7 1995 75.8 1970 70.8 Source: National Center for Health Statistics, published in the 1998 World Almanac 7. Make a scatterplot of the untransformed data on your calculator and circle which kind of relationship the points seem to follow (see page 1). Exponential Logarithmic Power 8. Which transformation would we use to make a logarithmic plot appear linear? 9. Use your calculator to transform the data, and find the regression line, r, and r. (4 points) 10. We do not need difficult Algebra for this question as we already have y-hat isolated on the left. Sketch the original scatterplot along with the Logarithmic function you just found Scatterplot with Log Function Residuals12. The data below represents Medicare expenditures from 1970 to 1996, in billions of dollars. (4 points) Year Medicare Expenditures (billions of dollars 1970 7.6 1980 37.5 1985 72.1 1990 1 12.1 1991 124.4 1992 141.4 1993 153 1994 169.8 1995 187.9 1996 203.1 For this data set, use your TI=83 to: A. Create a scatterplot of the data. B. Assume that the relationship of this data is exponential. Transform the data, find the regression equation, r, and . Based only on the value of r would you consider this a good model for extrapolationg increases in Medicare spending? C. Create and sketch the residual plot of the transformed data. Does the residual plot change your mind about the usefulness of this model to extrapolate increases in Medicare spending
Step by Step Solution
There are 3 Steps involved in it

Get step-by-step solutions from verified subject matter experts