

Question: I need help with part B step by step pls begin{tabular}{|r|r|} hline multicolumn{1}{|c|}{ A } & multicolumn{1}{|c|}{ B } hline multicolumn{1}{|l|}{ Date } &
I need help with part B
step by step pls
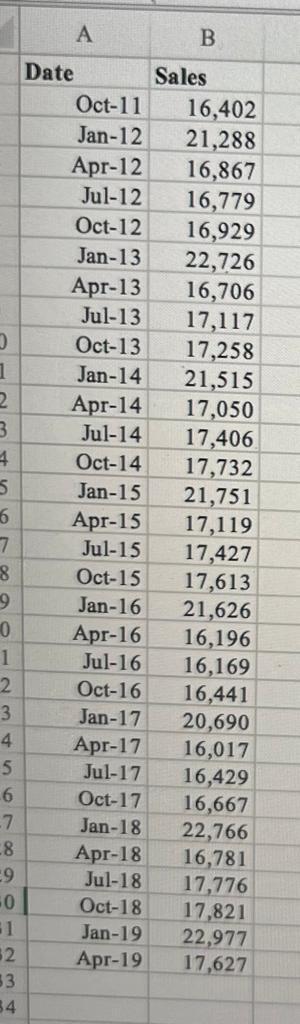
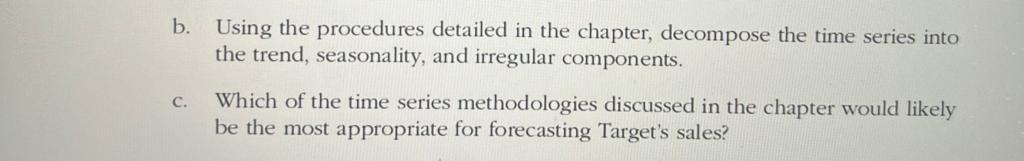
\begin{tabular}{|r|r|} \hline \multicolumn{1}{|c|}{ A } & \multicolumn{1}{|c|}{ B } \\ \hline \multicolumn{1}{|l|}{ Date } & \multicolumn{1}{l|}{ Sales } \\ \hline Oct-11 & 16,402 \\ \hline Jan-12 & 21,288 \\ \hline Apr-12 & 16,867 \\ \hline Jul-12 & 16,779 \\ \hline Oct-12 & 16,929 \\ \hline Jan-13 & 22,726 \\ \hline Apr-13 & 16,706 \\ \hline Jul-13 & 17,117 \\ \hline Oct-13 & 17,258 \\ \hline Jan-14 & 21,515 \\ \hline Apr-14 & 17,050 \\ \hline Jul-14 & 17,406 \\ \hline Oct-14 & 17,732 \\ \hline Jan-15 & 21,751 \\ \hline Apr-15 & 17,119 \\ \hline Jul-15 & 17,427 \\ \hline Oct-15 & 17,613 \\ \hline Jan-16 & 21,626 \\ \hline Apr-16 & 16,196 \\ \hline Jul-16 & 16,169 \\ \hline Oct-16 & 16,441 \\ \hline Jan-17 & 20,690 \\ \hline Apr-17 & 16,017 \\ \hline Jul-17 & 16,429 \\ \hline Oct-17 & 16,667 \\ \hline Jan-18 & 22,766 \\ \hline Apr-18 & 16,781 \\ \hline Jul-18 & 17,776 \\ \hline Oct-18 & 17,821 \\ \hline Jan-19 & 22,977 \\ \hline Apr-19 & 17,627 \\ \hline \end{tabular} Using the procedures detailed in the chapter, decompose the time series into the trend, seasonality, and irregular components. .. Which of the time series methodologies discussed in the chapter would likely be the most appropriate for forecasting Target's sales
Step by Step Solution
There are 3 Steps involved in it

Get step-by-step solutions from verified subject matter experts