

Question: I need help with understanding If necessary, move the chart so it does not cover the table data. Add a slicer to the table so
I need help with understanding
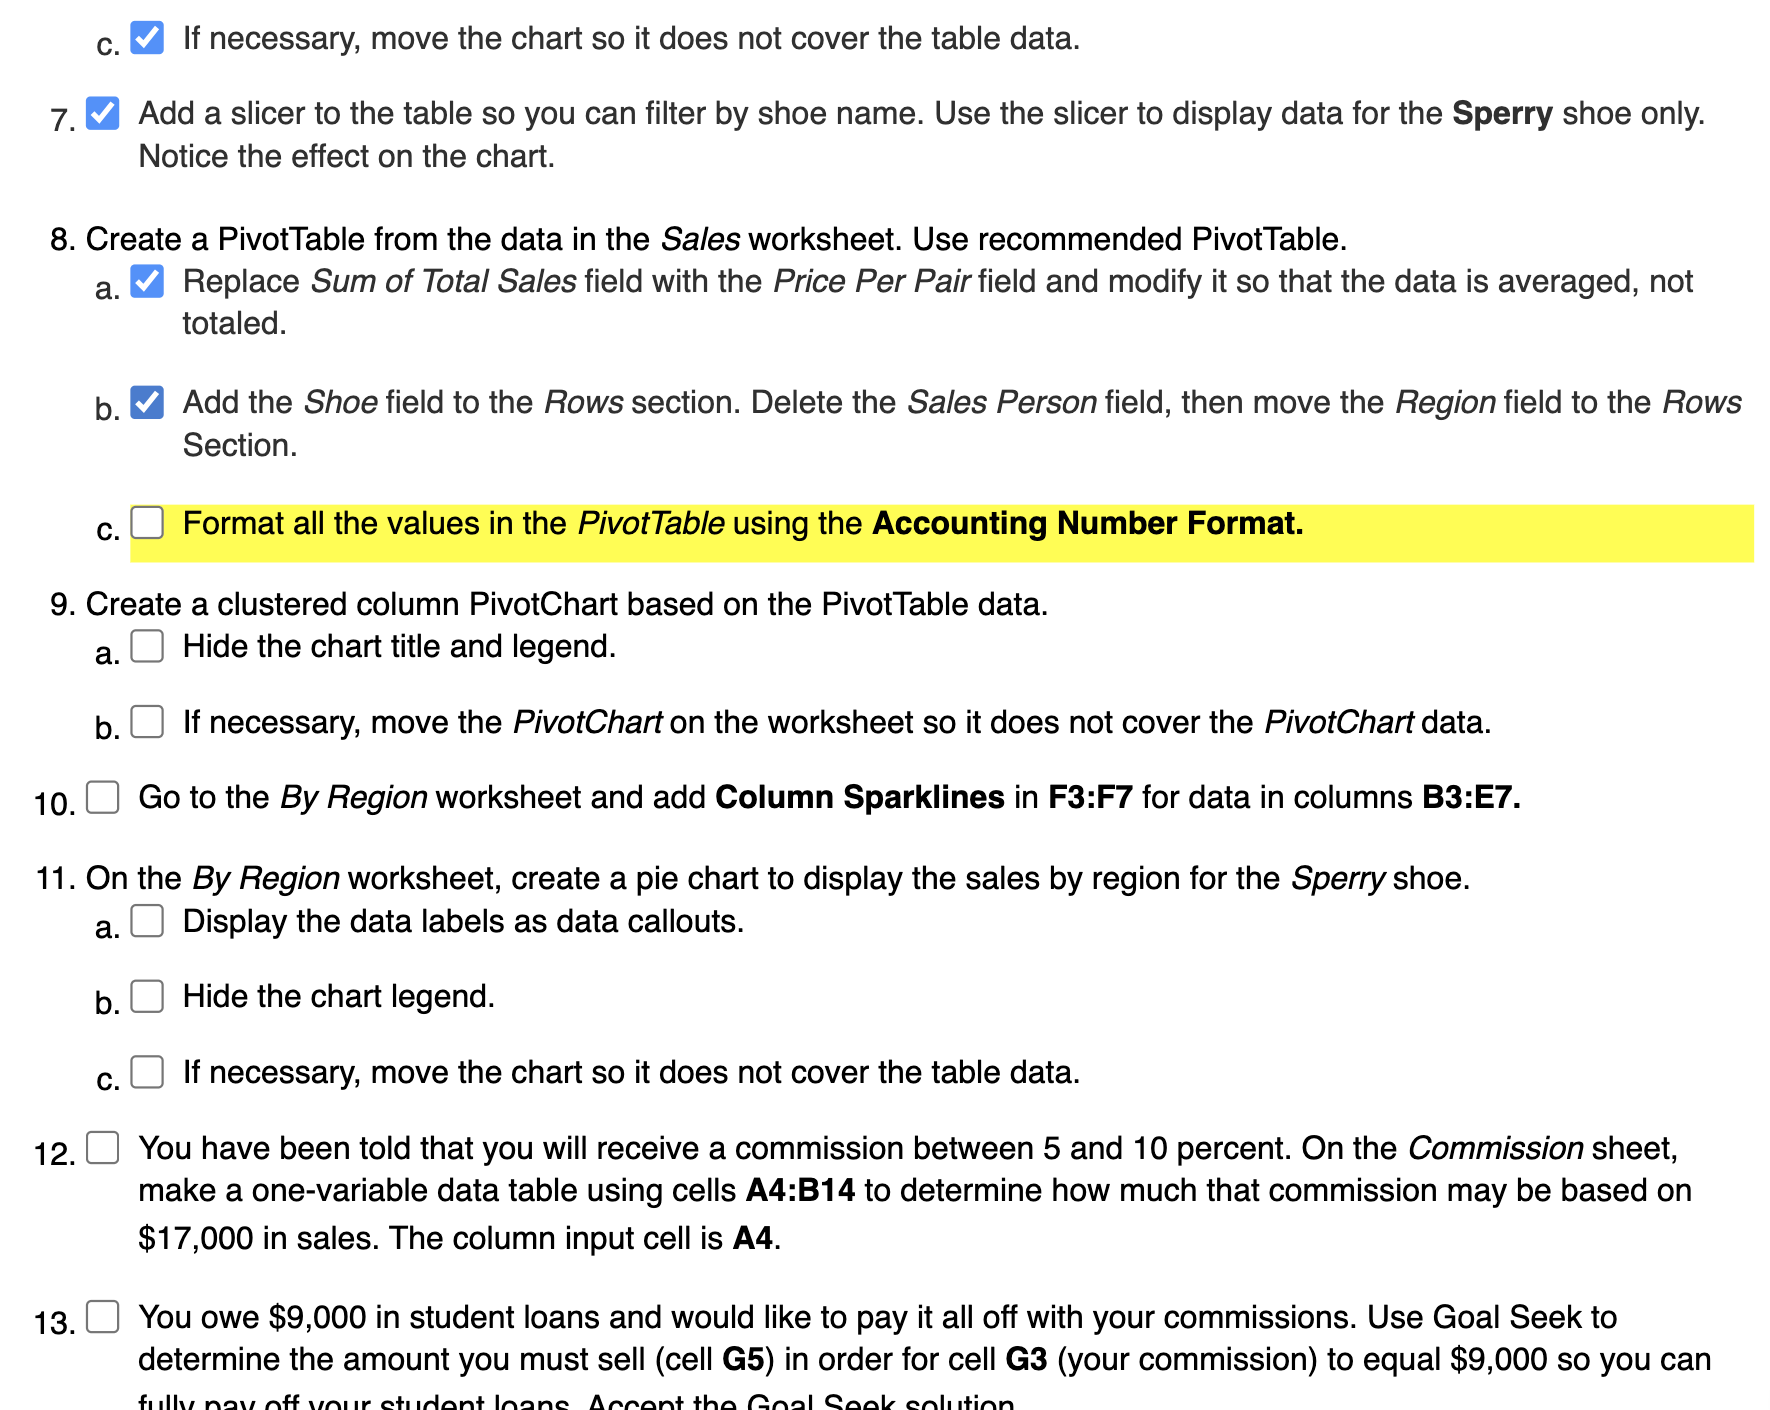
If necessary, move the chart so it does not cover the table data.
Add a slicer to the table so you can filter by shoe name. Use the slicer to display data for the Sperry shoe only.
Notice the effect on the chart.
Create a PivotTable from the data in the Sales worksheet. Use recommended PivotTable.
a Replace Sum of Total Sales field with the Price Per Pair field and modify it so that the data is averaged, not
totaled.
b Add the Shoe field to the Rows section. Delete the Sales Person field, then move the Region field to the Rows
Section.
c
Format all the values in the PivotTable using the Accounting Number Format.
Create a clustered column PivotChart based on the PivotTable data.
a Hide the chart title and legend.
b If necessary, move the PivotChart on the worksheet so it does not cover the PivotChart data.
Go to the By Region worksheet and add Column Sparklines in F:F for data in columns B:E
On the By Region worksheet, create a pie chart to display the sales by region for the Sperry shoe.
a Display the data labels as data callouts.
b Hide the chart legend.
c If necessary, move the chart so it does not cover the table data.
You have been told that you will receive a commission between and percent. On the Commission sheet,
make a onevariable data table using cells A:B to determine how much that commission may be based on
$ in sales. The column input cell is A
You owe $ in student loans and would like to pay it all off with your commissions. Use Goal Seek to
determine the amount you must sell cell G in order for cell Gyour commission to equal $ so you can
Step by Step Solution
There are 3 Steps involved in it
1 Expert Approved Answer
Step: 1 Unlock

Question Has Been Solved by an Expert!
Get step-by-step solutions from verified subject matter experts
Step: 2 Unlock
Step: 3 Unlock