

Question: I need question seven calculated and explained please! 6. You have two risky assets stocks and bonds with returns and risk as shown in the
I need question seven calculated and explained please!
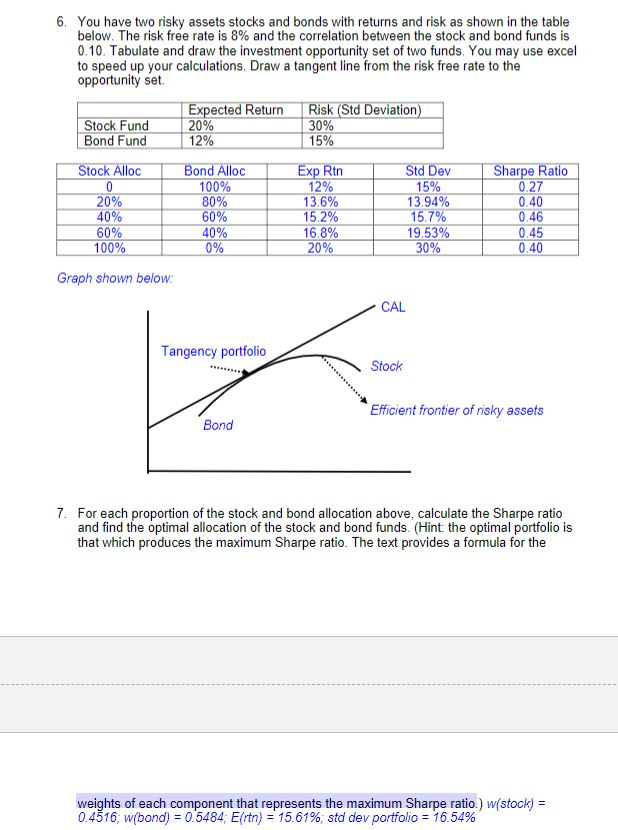
6. You have two risky assets stocks and bonds with returns and risk as shown in the table below. The risk free rate is 8% and the correlation between the stock and bond funds is 0.10. Tabulate and draw the investment opportunity set of two funds. You may use excel to speed up your calculations. Draw a tangent line from the risk free rate to the opportunity set. Expected Return Risk (Std Deviation) | Stock Fund 20% 30% Bond Fund 12% 15% Stock Alloc Bond Alloc 100% 80% 60% 20% 40% 60% 100% Exp Rtn 12% 13.6% 15.2% 16.8% 20% Std Dev 15% 13.94% 15.7% 19.53% 30% Sharpe Ratio 0.27 0.40 0.46 0.45 0.40 40% 0% Graph shown below: CAL Tangency portfolio Stock Efficient frontier of risky assets Bond 7. For each proportion of the stock and bond allocation above, calculate the Sharpe ratio and find the optimal allocation of the stock and bond funds. (Hint: the optimal portfolio is that which produces the maximum Sharpe ratio. The text provides a formula for the weights of each component that represents the maximum Sharpe ratio.) w/stock) = 0.4516, w(bond) = 0.5484. Ertn) = 15.61%, std dev portfolio = 16.54%
Step by Step Solution
There are 3 Steps involved in it

Get step-by-step solutions from verified subject matter experts