

Question: Question 5. (24 marks) Suppose that there are only two risky assets (stocks) A and B in the market. Statistics for stocks A and B
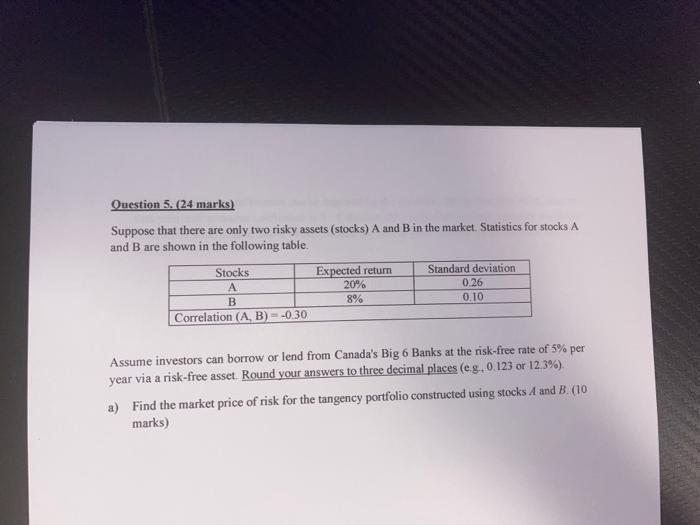
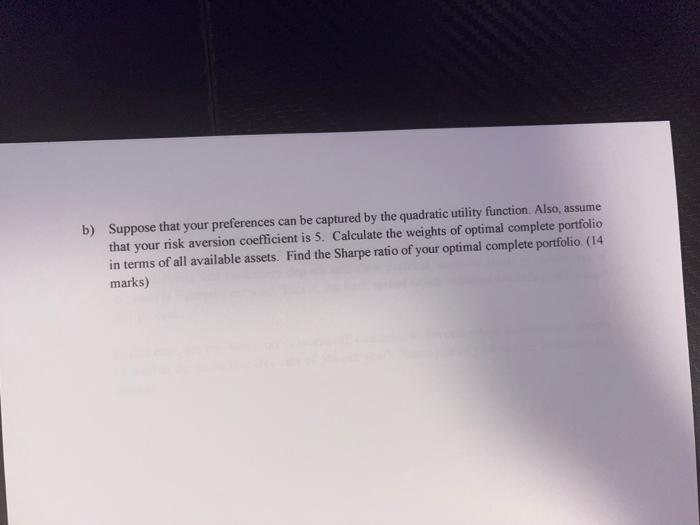
Question 5. (24 marks) Suppose that there are only two risky assets (stocks) A and B in the market. Statistics for stocks A and B are shown in the following table. Stocks Expected return Standard deviation A 20% 0.26 B 8% 0.10 Correlation (A, B) = -0.30 Assume investors can borrow or lend from Canada's Big 6 Banks at the risk-free rate of 5% per year via a risk-free asset. Round your answers to three decimal places (eg 0.123 or 12,3%). a) Find the market price of risk for the tangency portfolio constructed using stocks A and B. (10 marks) b) Suppose that your preferences can be captured by the quadratic utility function. Also, assume that your risk aversion coefficient is 5. Calculate the weights of optimal complete portfolio in terms of all available assets. Find the Sharpe ratio of your optimal complete portfolio (14 marks) Question 5. (24 marks) Suppose that there are only two risky assets (stocks) A and B in the market. Statistics for stocks A and B are shown in the following table. Stocks Expected return Standard deviation A 20% 0.26 B 8% 0.10 Correlation (A, B) = -0.30 Assume investors can borrow or lend from Canada's Big 6 Banks at the risk-free rate of 5% per year via a risk-free asset. Round your answers to three decimal places (eg 0.123 or 12,3%). a) Find the market price of risk for the tangency portfolio constructed using stocks A and B. (10 marks) b) Suppose that your preferences can be captured by the quadratic utility function. Also, assume that your risk aversion coefficient is 5. Calculate the weights of optimal complete portfolio in terms of all available assets. Find the Sharpe ratio of your optimal complete portfolio (14 marks)
Step by Step Solution
There are 3 Steps involved in it

Get step-by-step solutions from verified subject matter experts