

Question: I need the following code to output two graphs using matplotlib. I am suppose to use the subplots() function to have two side by side
I need the following code to output two graphs using matplotlib. I am suppose to use the subplots() function to have two side by side graphs for comparison. Using the code i have already written, can someone help me get to the two graphs. I have also attached the formatting code. I really just need help implementing the subplots() function that works with my code on the specified output. Other specifications include the high temperatures plotted in red and the lows plotted in blue for each graph as well as the space between the highs and lows shaded in a lighter blue. I have provided the code for the shading.
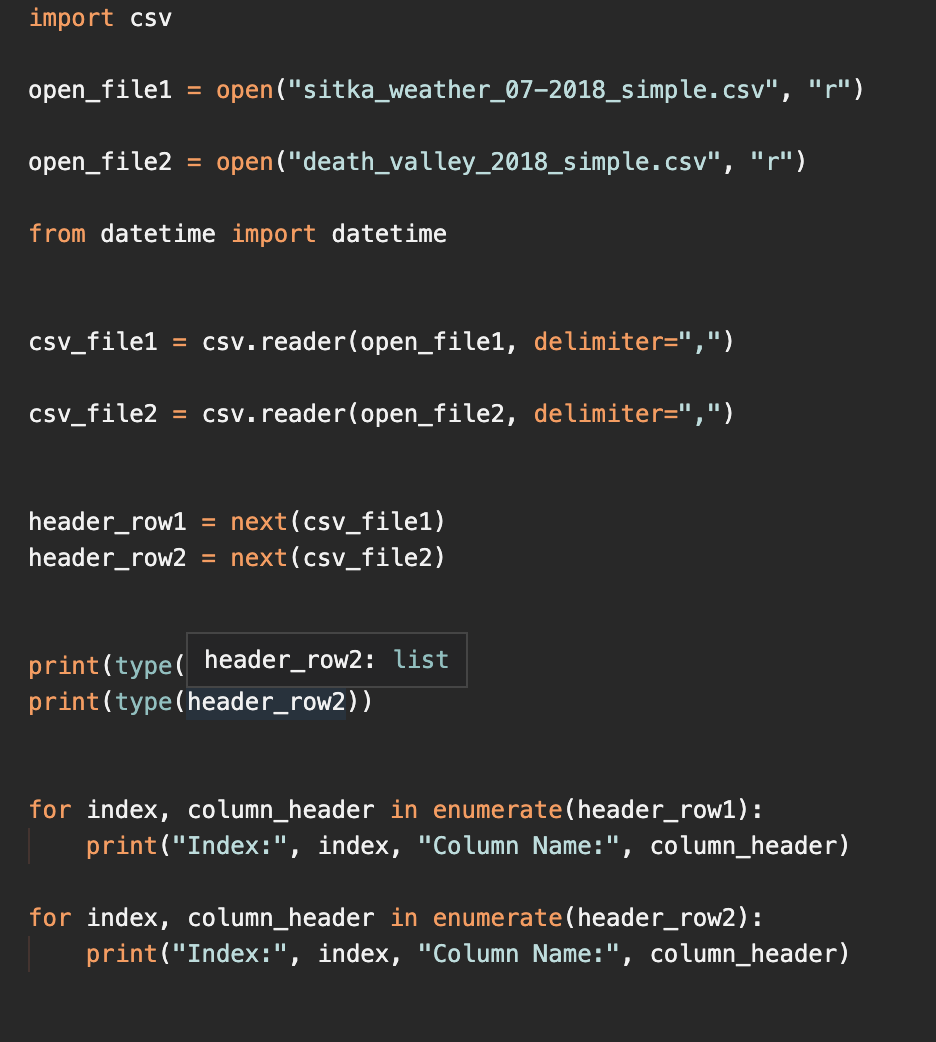
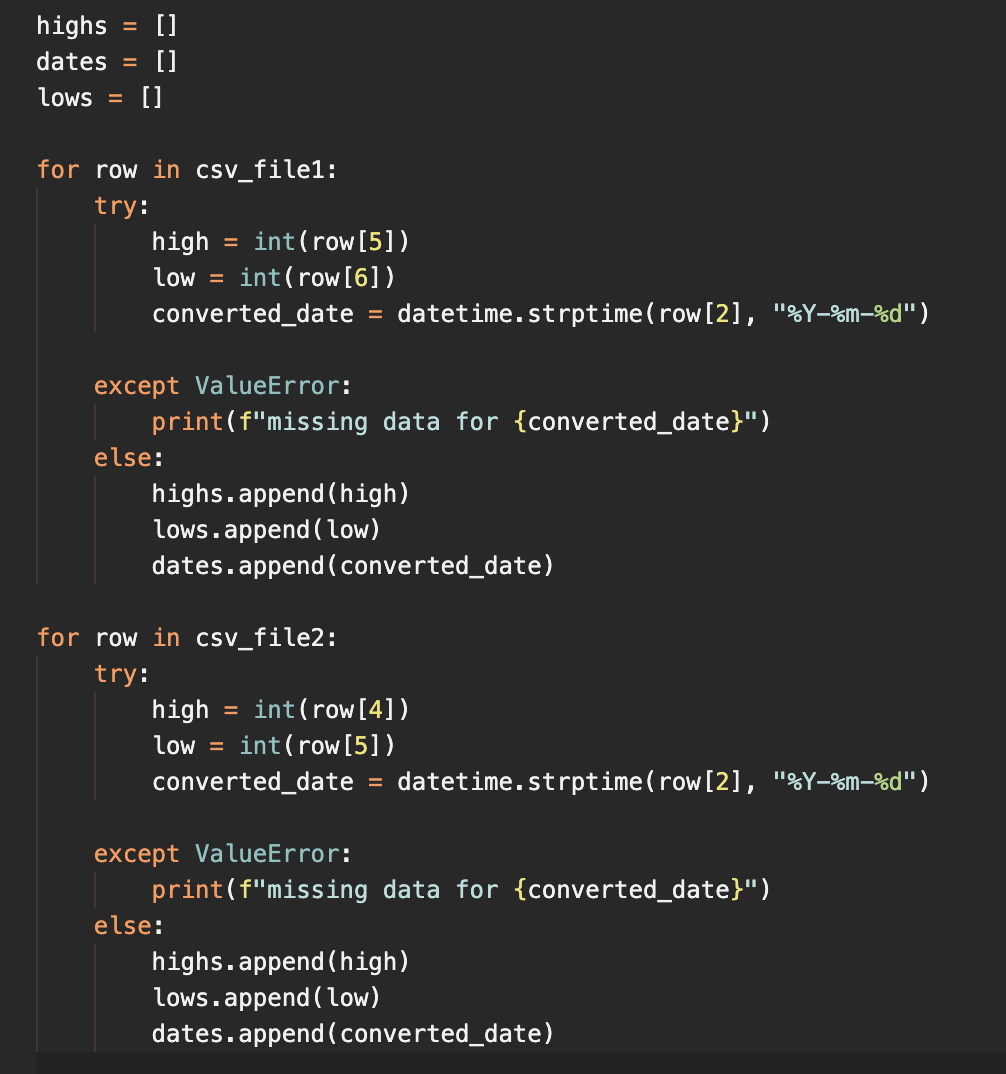
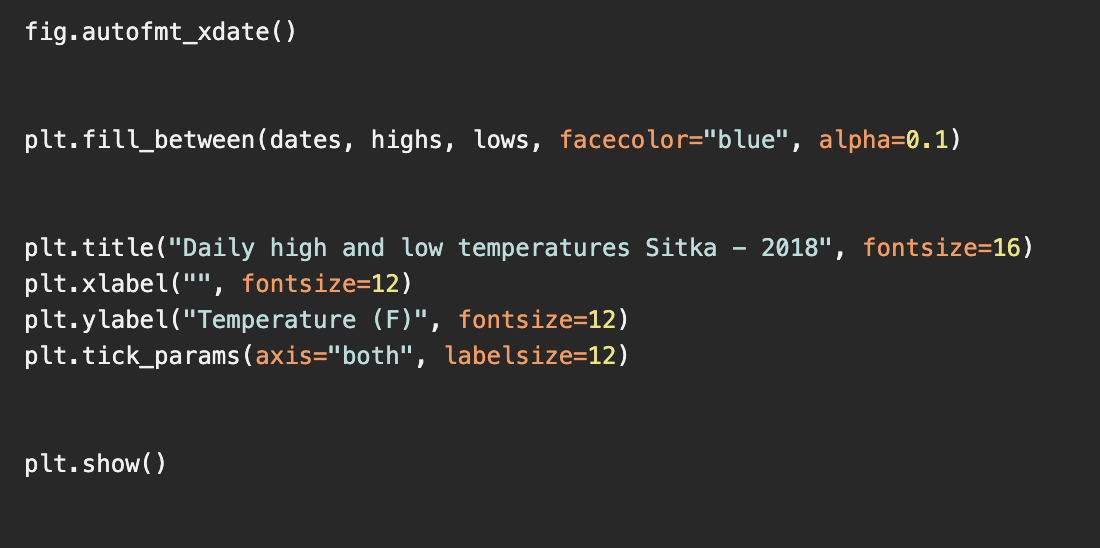
import csv open_file1 = open("sitka_weather_072018_simple.csv", "r") open_file2 = open("death_valley_2018_simple.csv", "r") from datetime import datetime csv_file1 csv. reader(open_filei, delimiter=",") csv_file2 csv. reader(open_file2, delimiter=",") header_row1 = next(csv_file1) header_row2 = next(csv_file2) print(type( header_row2: list print(type (header_row2)) for index, column_header in enumerate(header_rowl): print("Index:", index, "Column Name:", column_header) for index, column_header in enumerate(header_row2): print("Index:", index, "Column Name:", column_header) highs dates lows [] [] [] for row in csv_file1: try: high int(row[5]) low = int(row[6]). converted_date = datetime.strptime ( row[2], "%Y-%m-%d") except ValueError: print(f"missing data for {converted_date}") else: highs.append(high) lows.append(low) dates.append(converted_date) for row in csv_file2: try: high int(row [4]) low = int(row [5]). converted_date = datetime. strptime ( row [2], "%Y-%m-%d") = except ValueError: print(f"missing data for {converted_date}") else: highs.append(high) lows.append (low) dates.append(converted_date) fig.autofmt_xdate() plt.fill_between (dates, highs, lows, facecolor="blue", alpha=0.1) 2018", fontsize=16) plt.title("Daily high and low temperatures Sitka plt.xlabel("", fontsize=12) plt.ylabel("Temperature (F)", fontsize=12) plt.tick_params (axis="both", labelsize=12) plt.show() import csv open_file1 = open("sitka_weather_072018_simple.csv", "r") open_file2 = open("death_valley_2018_simple.csv", "r") from datetime import datetime csv_file1 csv. reader(open_filei, delimiter=",") csv_file2 csv. reader(open_file2, delimiter=",") header_row1 = next(csv_file1) header_row2 = next(csv_file2) print(type( header_row2: list print(type (header_row2)) for index, column_header in enumerate(header_rowl): print("Index:", index, "Column Name:", column_header) for index, column_header in enumerate(header_row2): print("Index:", index, "Column Name:", column_header) highs dates lows [] [] [] for row in csv_file1: try: high int(row[5]) low = int(row[6]). converted_date = datetime.strptime ( row[2], "%Y-%m-%d") except ValueError: print(f"missing data for {converted_date}") else: highs.append(high) lows.append(low) dates.append(converted_date) for row in csv_file2: try: high int(row [4]) low = int(row [5]). converted_date = datetime. strptime ( row [2], "%Y-%m-%d") = except ValueError: print(f"missing data for {converted_date}") else: highs.append(high) lows.append (low) dates.append(converted_date) fig.autofmt_xdate() plt.fill_between (dates, highs, lows, facecolor="blue", alpha=0.1) 2018", fontsize=16) plt.title("Daily high and low temperatures Sitka plt.xlabel("", fontsize=12) plt.ylabel("Temperature (F)", fontsize=12) plt.tick_params (axis="both", labelsize=12) plt.show()
Step by Step Solution
There are 3 Steps involved in it

Get step-by-step solutions from verified subject matter experts