

Question: I need with this practice in excel. 40 people are randomly sent to walk one of four trails. The time (in minutes) they spend completing
I need with this practice in excel.
40 people are randomly sent to walk one of four trails. The time (in minutes) they spend completing each trail is recorded in the table below.
(a) How do I test to see if the times needed for the trail vary? (0.05 significance level)
(b) How do I test each pair (A/B, A/C, A/D, B/C, B/D, C/D) to see which trails have a statistically significant difference? Instead of using confidence intervals, use =ttest function in Excel (using tails=2 and type=3). Also how do I Indicate the p-value for each comparison, and when the effect is statistically significant (0.05 as the significance level), how do I declare which trail of the two takes more time to complete?
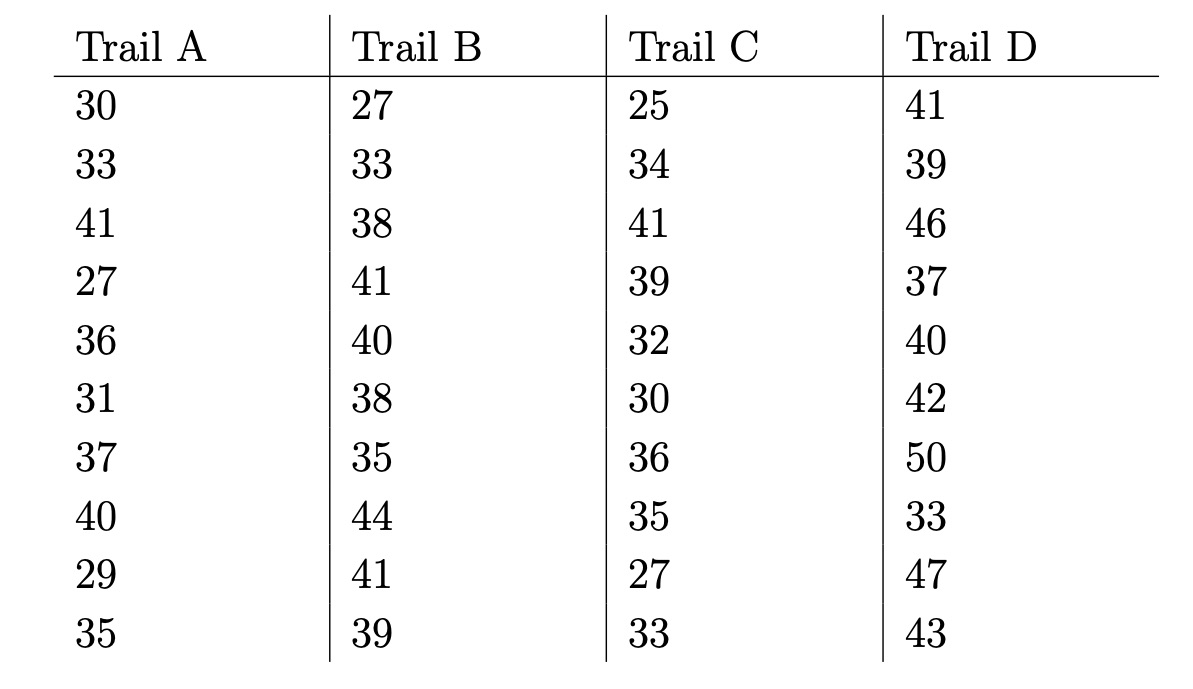
Trail A Trail B Trail C Trail D 30 27 25 41 33 33 34 39 41 38 41 46 27 41 39 37 36 40 32 40 31 38 30 42 37 35 36 50 40 44 35 33 29 41 27 47 35 39 33 43
Step by Step Solution
There are 3 Steps involved in it

Get step-by-step solutions from verified subject matter experts