

Question: I want the solution. without using Excel because we don't use excel in the exam. A Quality Analyst wants to construct charts for controlling a
I want the solution. without using Excel because we don't use excel in the exam. 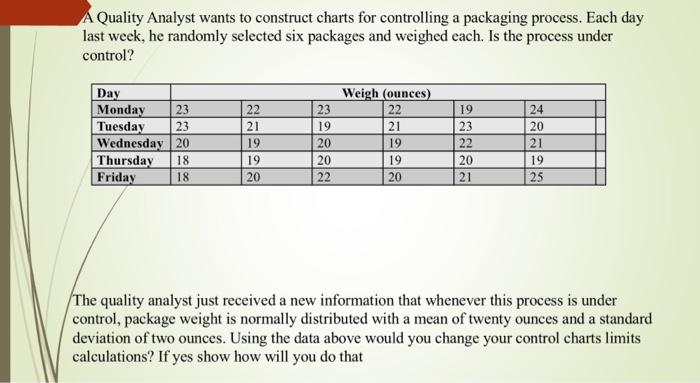
A Quality Analyst wants to construct charts for controlling a packaging process. Each day last week, he randomly selected six packages and weighed each. Is the process under control? The quality analyst just received a new information that whenever this process is under control, package weight is normally distributed with a mean of twenty ounces and a standard deviation of two ounces. Using the data above would you change your control charts limits calculations? If yes show how will you do that
Step by Step Solution
There are 3 Steps involved in it
1 Expert Approved Answer
Step: 1 Unlock

Question Has Been Solved by an Expert!
Get step-by-step solutions from verified subject matter experts
Step: 2 Unlock
Step: 3 Unlock