

Question: I will vote your Answer Definitely please give me Right answer of my question Wilcoxon Rank Sum Statistic T Suppose that n, observations are available
I will vote your Answer Definitely please give me Right answer of my question
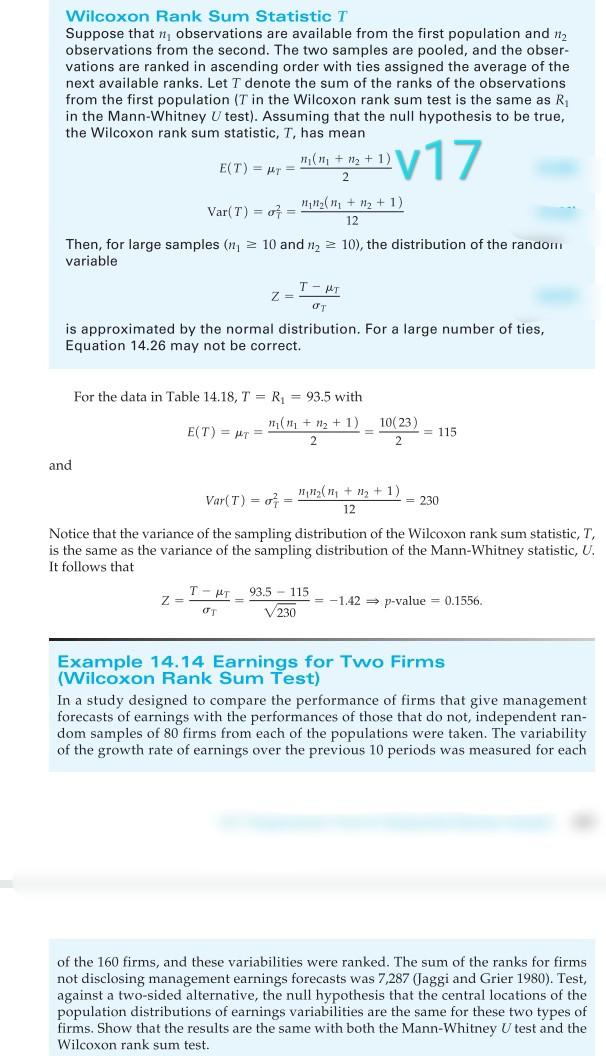
Wilcoxon Rank Sum Statistic T Suppose that n, observations are available from the first population and 12 observations from the second. The two samples are pooled, and the obser- vations are ranked in ascending order with ties assigned the average of the next available ranks. Let T denote the sum of the ranks of the observations from the first population (T in the Wilcoxon rank sum test is the same as R in the Mann-Whitney U test). Assuming that the null hypothesis to be true, the Wilcoxon rank sum statistic, T, has mean ( + 12 + 1) E(T) = Mr = 2017 111112111 + 12 + 1) Var(T) = 0 = 12 Then, for large samples (n = 10 and 12 > 10), the distribution of the random variable T-MT Z= is approximated by the normal distribution. For a large number of ties, Equation 14.26 may not be correct. For the data in Table 14.18, T = R = 93.5 with m( + 12 + 1) E(T) = HT 10(23) = 115 2 and Var(T) = 0 = ";22(11 + 12 +1) 230 12 Notice that the variance of the sampling distribution of the Wilcoxon rank sum statistic, T, is the same as the variance of the sampling distribution of the Mann-Whitney statistic, U. It follows that T-HT93.5 - 115 Z= = -1.42 = p-value = 0.1556. V230 Example 14.14 Earnings for Two Firms (Wilcoxon Rank Sum Test) In a study designed to compare the performance of firms that give management forecasts of earnings with the performances of those that do not, independent ran- dom samples of 80 firms from each of the populations were taken. The variability of the growth rate of earnings over the previous 10 periods was measured for each of the 160 firms, and these variabilities were ranked. The sum of the ranks for firms not disclosing management earnings forecasts was 7,287 (Jaggi and Grier 1980). Test, against a two-sided alternative, the null hypothesis that the central locations of the population distributions of earnings variabilities are the same for these two types of firms. Show that the results are the same with both the Mann-Whitney U test and the Wilcoxon rank sum testStep by Step Solution
There are 3 Steps involved in it
1 Expert Approved Answer
Step: 1 Unlock

Question Has Been Solved by an Expert!
Get step-by-step solutions from verified subject matter experts
Step: 2 Unlock
Step: 3 Unlock