

Question: In Matlab please do this problem and show the code. 2. Plot the pole-zero plot and the signal that corresponds to the transform X(s)=s+c1 for
In Matlab please do this problem and show the code. 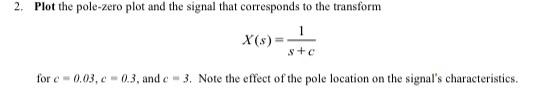
2. Plot the pole-zero plot and the signal that corresponds to the transform X(s)=s+c1 for c=0.03,c=0.3, and c=3. Note the effect of the pole location on the signal's characteristics
Step by Step Solution
There are 3 Steps involved in it
1 Expert Approved Answer
Step: 1 Unlock

Question Has Been Solved by an Expert!
Get step-by-step solutions from verified subject matter experts
Step: 2 Unlock
Step: 3 Unlock