

Question: In MATLAB variable.) 2. Data for four pairs of variables are provided. Use the subplot feature to plot each pai of points separately in a
In MATLAB 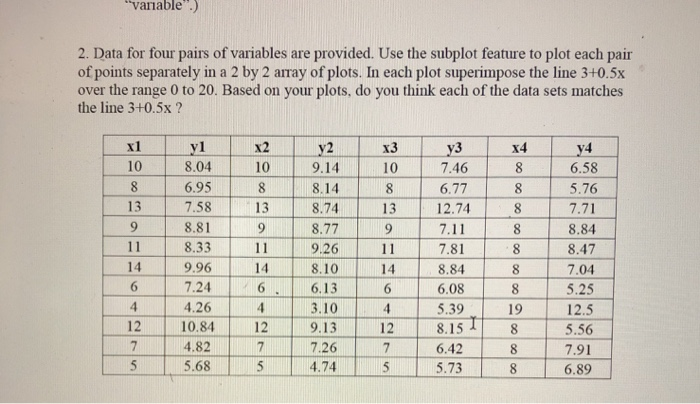
variable".) 2. Data for four pairs of variables are provided. Use the subplot feature to plot each pai of points separately in a 2 by 2 array of plots. In each plot superimpose the line 3+0.5x over the range 0 to 20. Based on your plots, do you think each of the data sets matches the line 3+0.5x? yl 8.04 6.95 13 7.58 8.81 x3 10 X4 10 9.14 8.14 8.74 13 1 8.77 7.46 6.77 12.74 7.11 11 8.33 9.26 1 7.81 8.84 6.08 5.39 8.15 6.42 5 5.685 4.74 5 5.73 10 6.58 5.76 7.71 8.84 8.47 7.04 5.25 12.5 5.56 8 7.91 6.89 13 9 9.96 7.24 4.26 10.84 4.82 14 8.10 6.13 3.10 9.13 7.26 19 12 12
Step by Step Solution
There are 3 Steps involved in it
1 Expert Approved Answer
Step: 1 Unlock

Question Has Been Solved by an Expert!
Get step-by-step solutions from verified subject matter experts
Step: 2 Unlock
Step: 3 Unlock