

Question: In Module Seven, review other learners' posts and provide two of them with your feedback (providing feedback for peers without any feedback first). Address the
In Module Seven, review other learners' posts and provide two of them with your feedback (providing feedback for peers without any feedback first). Address the following points:
Review the visuals posted by your peers and provide your feedback by answering the following questions:
Are the visuals complete and accurate, representing all required analyses? Explain.
Are their visuals the same as yours? If not, speculate on why there could be differences when you worked with the same data.
Review the executive summaries posted, and answer the following questions:
Are the executive summaries clear, concise, and complete? Identify at least one strength and one area for improvement for each summary.
Do you agree with the findings and recommendations in the summaries? Why or why not?
I have prior experience with data analysis or visualization. The tool that I have used before is excel. Although I have found Tableau to be simple and easy to use, there are some similarities with excel. The first similarity is that the two are used in data organization. They help organize and store unprocessed information in a systematic manner. Users can use the two to create tables, which can help to organize data in a perfect manner. The second similarity is that the two tools can help in graphing. They are perfect for graphing because they have the capacity of generating a wide range of charts that are used to represent statistical data in a more visual manner. Since the two have procedures and formulae, creating charts is simple and time-saving.
With my previous experience with data analysis, I did not find this assignment challenging. Although it took a bit of time to familiarize myself with tableau. I was able to get the concept, which made it easier for me to complete the assignment. Once I was familiar with its operations, I was able to generate visuals with ease. The one aspect of my visuals I would want to change is the different colors. I would want to have different colors for different aspects. That was, the graphs would be appealing and easy to understand.
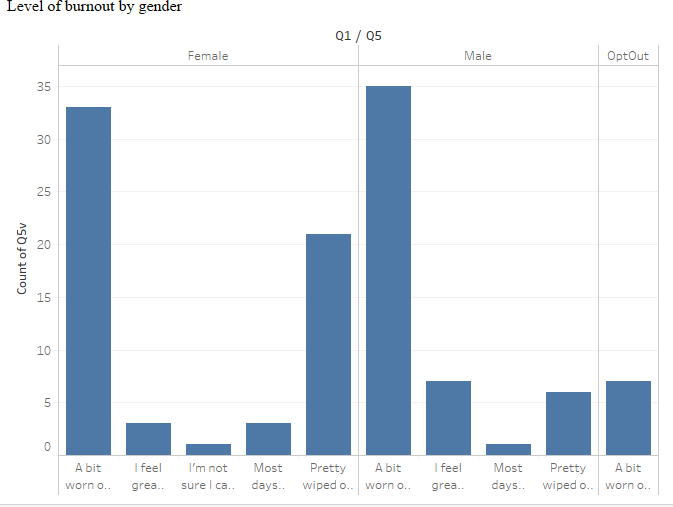
T.evel of hurnout he oender
Step by Step Solution
There are 3 Steps involved in it

Get step-by-step solutions from verified subject matter experts