

Question: Please comment what each line is doing. Need good explaining of what these two programs are doing. (Python) import matplotlib.pyplot as plt import numpy as
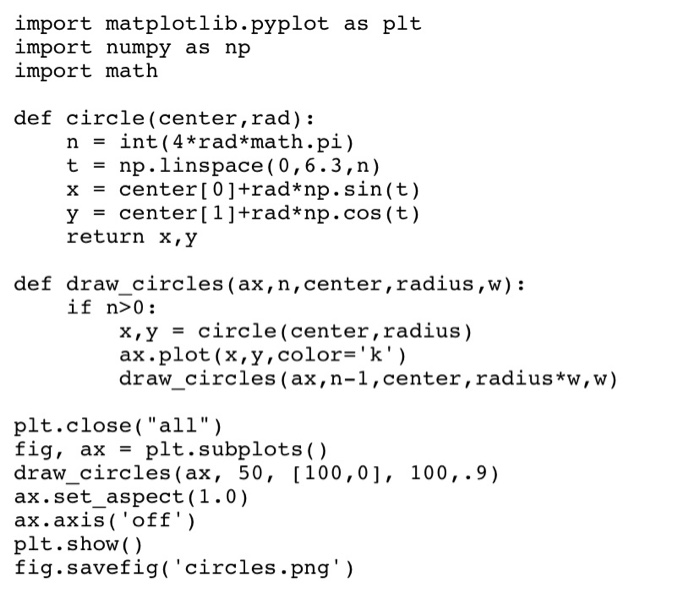
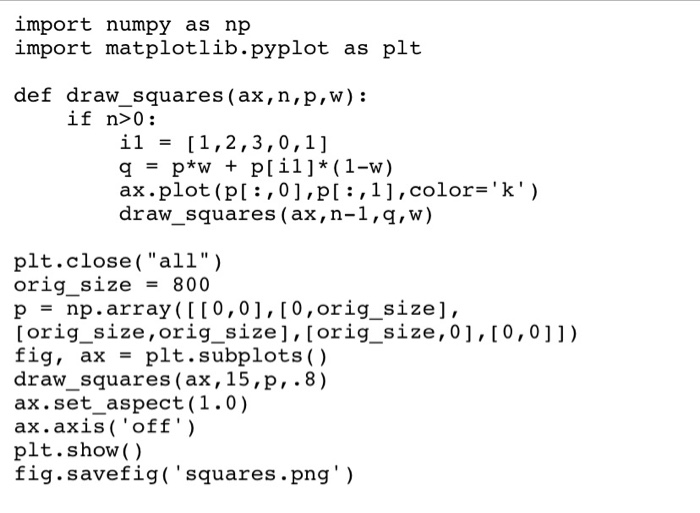
import matplotlib.pyplot as plt import numpy as np import math def circle (center,rad): n - int (4*rad*math.pi) t = np . linspace ( 0, 6.3,n) x = center [0]+rad*np. Sin(t) y - center[ 1]+rad*np.cos (t) return x,y def draw circles(ax,n,center,radius,w): if n>0: x, y circle ( center, radius) ax.plot (x,y,color-'k') draw circles (ax, n-1 , center, radius*w,w) plt.close( "all") fig, ax - plt.subplots() draw_circles (ax, 50, [100,0], 100, .9) ax.set aspect (1.0) ax.axis 'off') plt.show () fig.savefig('circles.png' ) import numpy as np import matplotlib.pyplot as plt def draw_squares (ax, n,p,w): if n>0: qp*w + p[il]* (1-w) ax.plot (p[,0],p[:,1], color-'k') draw squares (ax,n-1,q,w) plt.close( "all") orig_size - 800 p - np.array(II0,01,i0,orig sizel, [orig_size,orig_size], [orig_size,0,[0,0]]) fig, ax = pit. subplots() draw-squares ( ax , 15, p , . 8 ) ax.set_aspect(1.0) ax.axis('off ') plt.show () fig.savefig( 'squares.png' )
Step by Step Solution
There are 3 Steps involved in it

Get step-by-step solutions from verified subject matter experts