

Question: In the clustered column chart in the range J 4 : P 1 8 , Yuki wants to show the expenses by type, not by
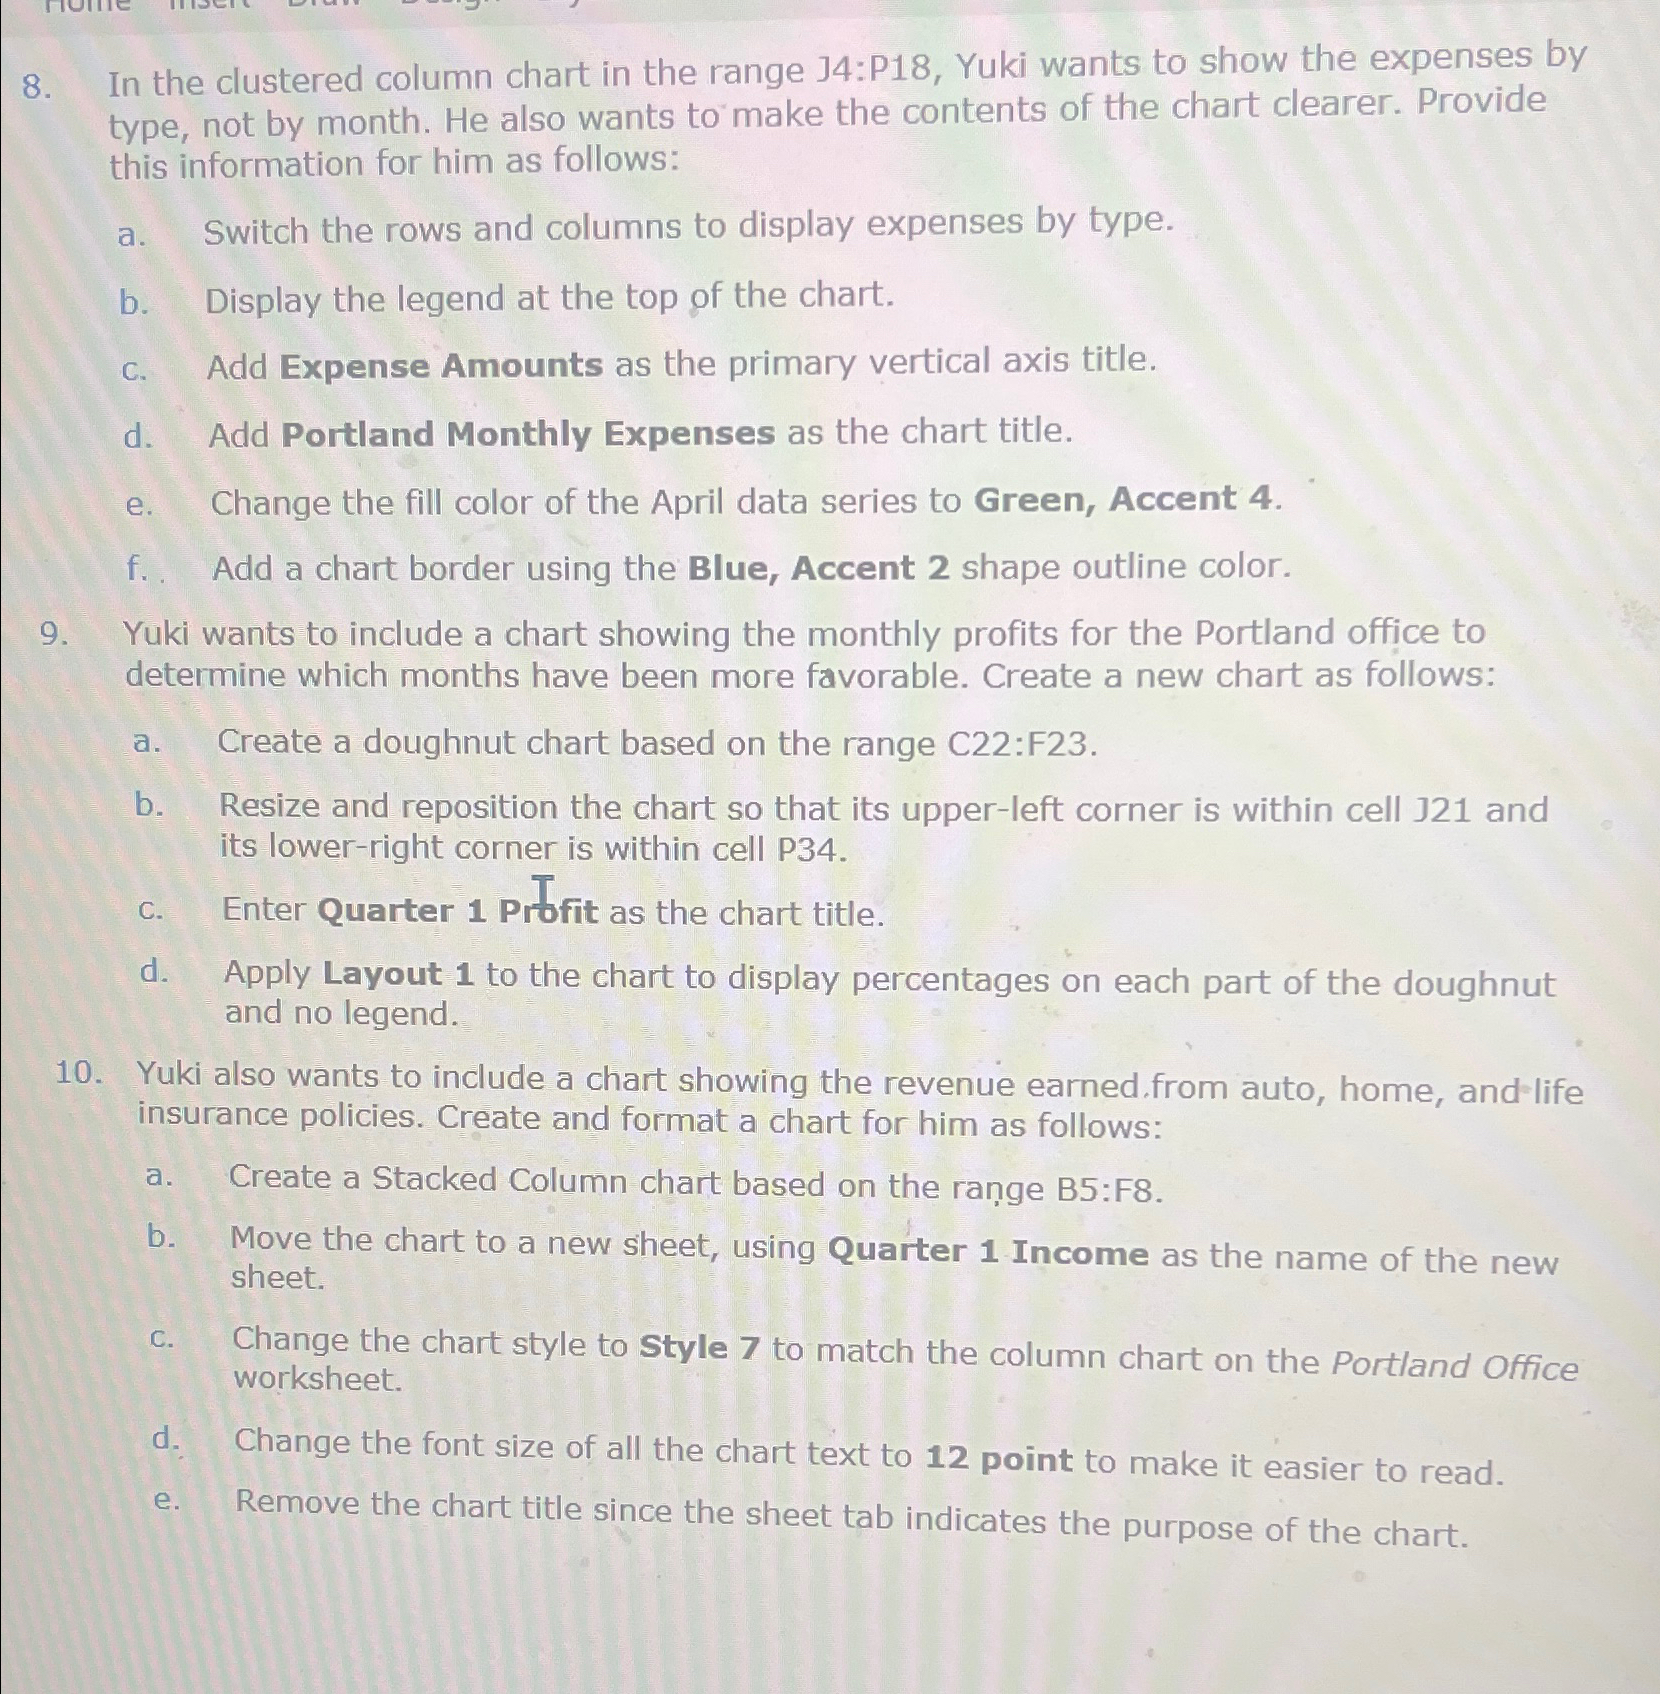
In the clustered column chart in the range : Yuki wants to show the expenses by type, not by month. He also wants to make the contents of the chart clearer. Provide this information for him as follows:
a Switch the rows and columns to display expenses by type.
b Display the legend at the top of the chart.
c Add Expense Amounts as the primary vertical axis title.
d Add Portland Monthly Expenses as the chart title.
e Change the fill color of the April data series to Green, Accent
f Add a chart border using the Blue, Accent shape outline color.
Yuki wants to include a chart showing the monthly profits for the Portland office to determine which months have been more favorable. Create a new chart as follows:
a Create a doughnut chart based on the range C:F
b Resize and reposition the chart so that its upperleft corner is within cell and its lowerright corner is within cell P
c Enter Quarter Prffit as the chart title.
d Apply Layout to the chart to display percentages on each part of the doughnut and no legend.
Yuki also wants to include a chart showing the revenue earned.from auto, home, andlife insurance policies. Create and format a chart for him as follows:
a Create a Stacked Column chart based on the range B:F
b Move the chart to a new sheet, using Quarter Income as the name of the new sheet.
c Change the chart style to Style to match the column chart on the Portland Office worksheet.
d Change the font size of all the chart text to point to make it easier to read.
e Remove the chart title since the sheet tab indicates the purpose of the chart.
Step by Step Solution
There are 3 Steps involved in it
1 Expert Approved Answer
Step: 1 Unlock

Question Has Been Solved by an Expert!
Get step-by-step solutions from verified subject matter experts
Step: 2 Unlock
Step: 3 Unlock