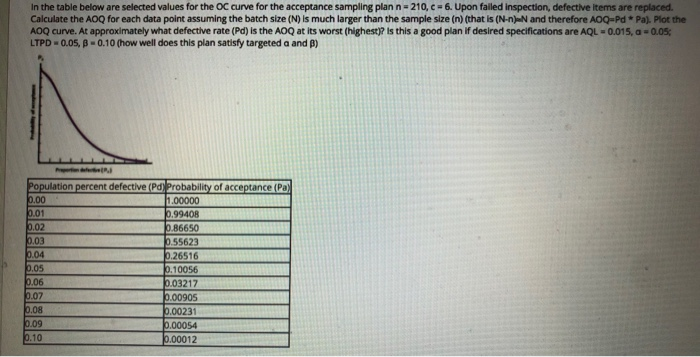
Question: In the table below are selected values for the OC curve for the acceptance sampling plan n = 210, c = 6. Upon failed inspection,

In the table below are selected values for the OC
In the table below are selected values for the OC curve for the acceptance sampling plan n = 210, c = 6. Upon failed inspection, defective items are replaced. Calculate the AOQ for each data point assuming the batch size (N) is much larger than the sample size (n) (that is (N-n) and therefore AOQ=Pd * Pa). Plot the AOQ curve. At approximately what defective rate (Pd) is the AOQ at its worst (highest)? Is this a good plan If desired specifications are AQL = 0.015, a = 0,05; LTPD -0.05, 8 -0.10 (how well does this plan satisfy targeted a and B) Population percent defective (Pd) Probability of acceptance (Pa) 0.00 1.00000 0.01 0.99408 0.02 0.86650 10.03 0.55623 0.04 0.26516 0.05 0.10056 0.06 9.03217 0.07 0.00905 0.08 0.00231 0.09 0.00054 0.10 0.00012

Step by Step Solution

There are 3 Steps involved in it

1 Expert Approved Answer
Step: 1 Unlock blur-text-image
Question Has Been Solved by an Expert!

Get step-by-step solutions from verified subject matter experts

Step: 2 Unlock
Step: 3 Unlock

Students Have Also Explored These Related General Management Questions!