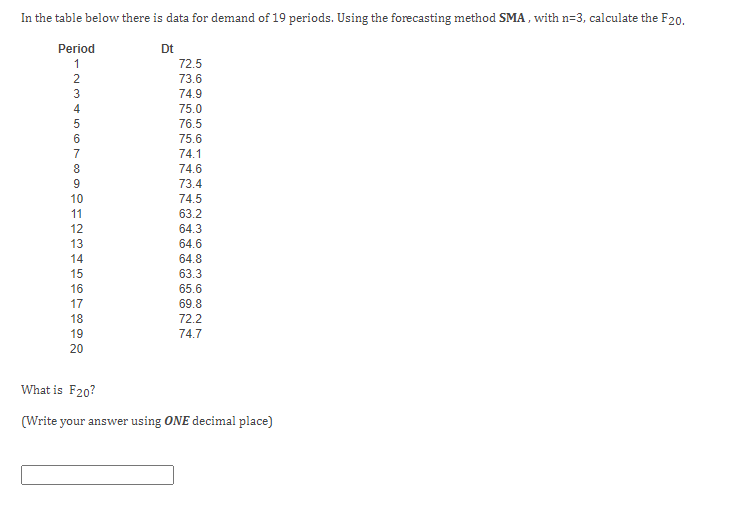
Question: In the table below there is data for demand of 19 periods. Using the forecasting method SMA, with n=3, calculate the F20. Period 1 2

In the table below there is data for demand of 19

In the table below there is data for demand of 19 periods. Using the forecasting method SMA, with n=3, calculate the F20. Period 1 2 3 4 5 6 7 8 9 10 11 12 13 14 15 16 17 18 19 20 Dt 72.5 73.6 74.9 75.0 76.5 75.6 74.1 74.6 73.4 74.5 63.2 64.3 64.6 64.8 63.3 65.6 69.8 72.2 74.7 What is F20? (Write your answer using ONE decimal place)

Step by Step Solution

There are 3 Steps involved in it

1 Expert Approved Answer
Step: 1 Unlock blur-text-image
Question Has Been Solved by an Expert!

Get step-by-step solutions from verified subject matter experts

Step: 2 Unlock
Step: 3 Unlock

Students Have Also Explored These Related General Management Questions!