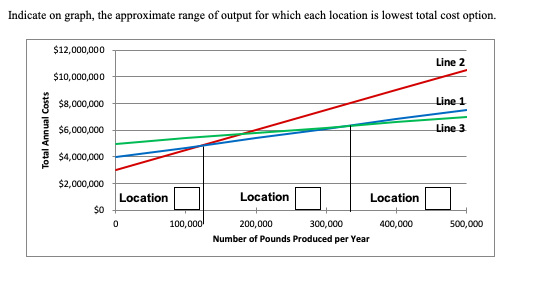
Question: Indicate on graph, the approximate range of output for which each location is lowest total cost option $12,000,000 Line 2 $10,000,000 $8,000,000 Line 1 Total

Indicate on graph, the approximate range ofIndicate on graph, the approximate range of

Indicate on graph, the approximate range of output for which each location is lowest total cost option $12,000,000 Line 2 $10,000,000 $8,000,000 Line 1 Total Annual Costs $6,000,000 Line 3 $4,000,000 $2,000,000 Location Location Location $0 0 100,000 400,000 500,000 200,000 300,000 Number of Pounds Produced per Year Problem 43 (cont.) In terms of pounds produced per year, calculate the specific range of output for which each location is the lowest total cost alternative, and then write your answers in the table below. Show work below table and round answers to whole number. Location Range of Production for which Location is Lowest Total Cost Alternative From To

Step by Step Solution

There are 3 Steps involved in it

1 Expert Approved Answer
Step: 1 Unlock blur-text-image
Question Has Been Solved by an Expert!

Get step-by-step solutions from verified subject matter experts

Step: 2 Unlock
Step: 3 Unlock

Students Have Also Explored These Related General Management Questions!