

Question: Individual assignment 2. Chapter 8 The table shows the indicators of the cash flows of the investment project for 6 years. Use the data on
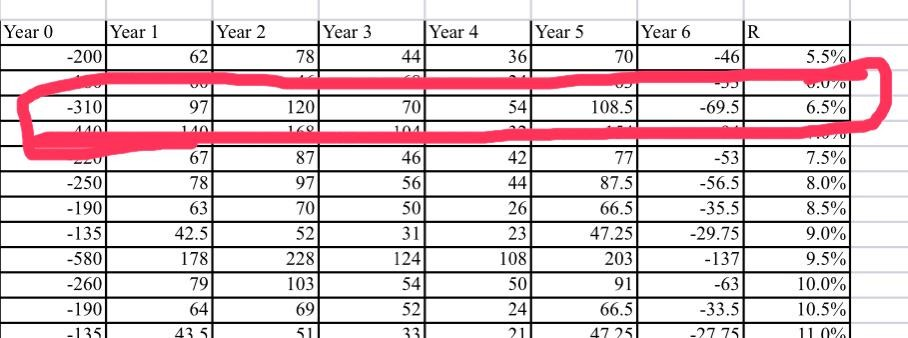
Individual assignment 2. Chapter 8 The table shows the indicators of the cash flows of the investment project for 6 years. Use the data on the line with your name. Calculate the net present value, payback period, modified internal rate of return (3 methods), profitability index of proposed projects. Fill in the table highlighted in yellow and enter your name and ID. After each calculated figure, indicate whether the project should be accepted or rejected based on the received data. In the last cell highlighted in red, give a general conclusion on the project and justify your decision. Year 0 Year 3 Year 1 -200 Year 2 62 Year 4 44 Year 5 36 Year 6 70 R -46 78 5.5% v.170 6.5% -310 97 120 70 54 108.5 -69.5 140 100 104 67 78 87 97 63 70 -250 -190 -135 -580 -260 -190 135. 42.5 178 79 64 435 521 228 103 69 51 46 56 501 31 124 54 52 33 42 44 26 23 108 50 24 77 87.5 66.5 47.25 203 91 66.5 -53 -56.5 -35.5 -29.75 - 137 -63 -33.5 2775 7.5% 8.0% 8.5% 9.0% 9.5% 10.0% 10.5% 110% 21 4725
Step by Step Solution
There are 3 Steps involved in it

Get step-by-step solutions from verified subject matter experts