

Question: Industry Demand Activity For your purposes, complete the form below with the average scenario. Assume the Round 1 growth rates will continue into the future
Industry Demand Activity
For your purposes, complete the form below with the "average" scenario. Assume the Round 1 growth rates will continue into the future unchanged. This will give you some idea for potential market size. If you have time, try a worst case and best case scenario for Rounds 2 through 8. For worst case, assume, say, half the growth rate. For best case assume, say, 1.5 times the growth rate. Use the information in the Courier to calculate the Round 1 demand for each of the segments. Once you have successfully entered the correct demand for Rounds 0 and 1, then the rest of the table will fill automatically. Incomplete
| Traditional | ||
|---|---|---|
| Rnd | Demand | Rate (%) |
| 0 | ||
| 1 | ||
| 2 | ||
| 3 | ||
| 4 | ||
| 5 | ||
| 6 | ||
| 7 | ||
| 8 | ||
| Low End | ||
|---|---|---|
| Rnd | Demand | Rate (%) |
| 0 | ||
| 1 | ||
| 2 | ||
| 3 | ||
| 4 | ||
| 5 | ||
| 6 | ||
| 7 | ||
| 8 | ||
| High End | ||
|---|---|---|
| Rnd | Demand | Rate (%) |
| 0 | ||
| 1 | ||
| 2 | ||
| 3 | ||
| 4 | ||
| 5 | ||
| 6 | ||
| 7 | ||
| 8 | ||
| Performance | ||
|---|---|---|
| Rnd | Demand | Rate (%) |
| 0 | ||
| 1 | ||
| 2 | ||
| 3 | ||
| 4 | ||
| 5 | ||
| 6 | ||
| 7 | ||
| 8 | ||
| Size | ||
|---|---|---|
| Rnd | Demand | Rate (%) |
| 0 | ||
| 1 | ||
| 2 | ||
| 3 | ||
| 4 | ||
| 5 | ||
| 6 | ||
| 7 | ||
| 8 | ||
The Round 0 Capstone Courier
FROM MY CURRIOR :
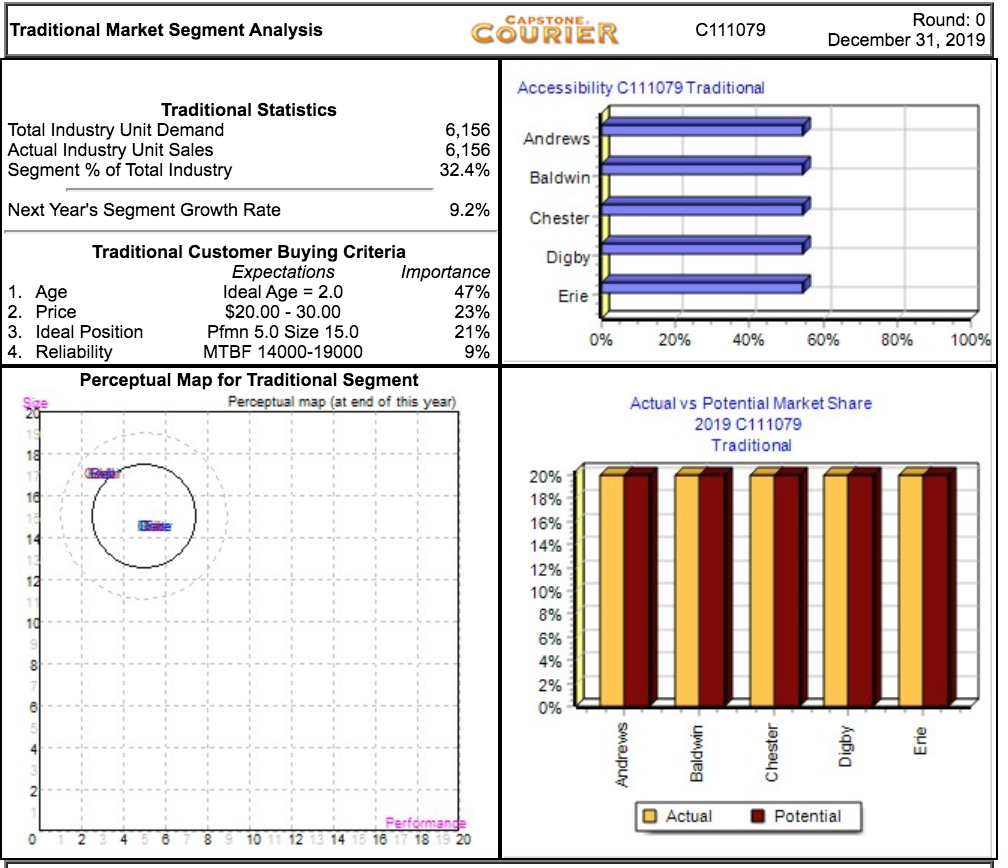
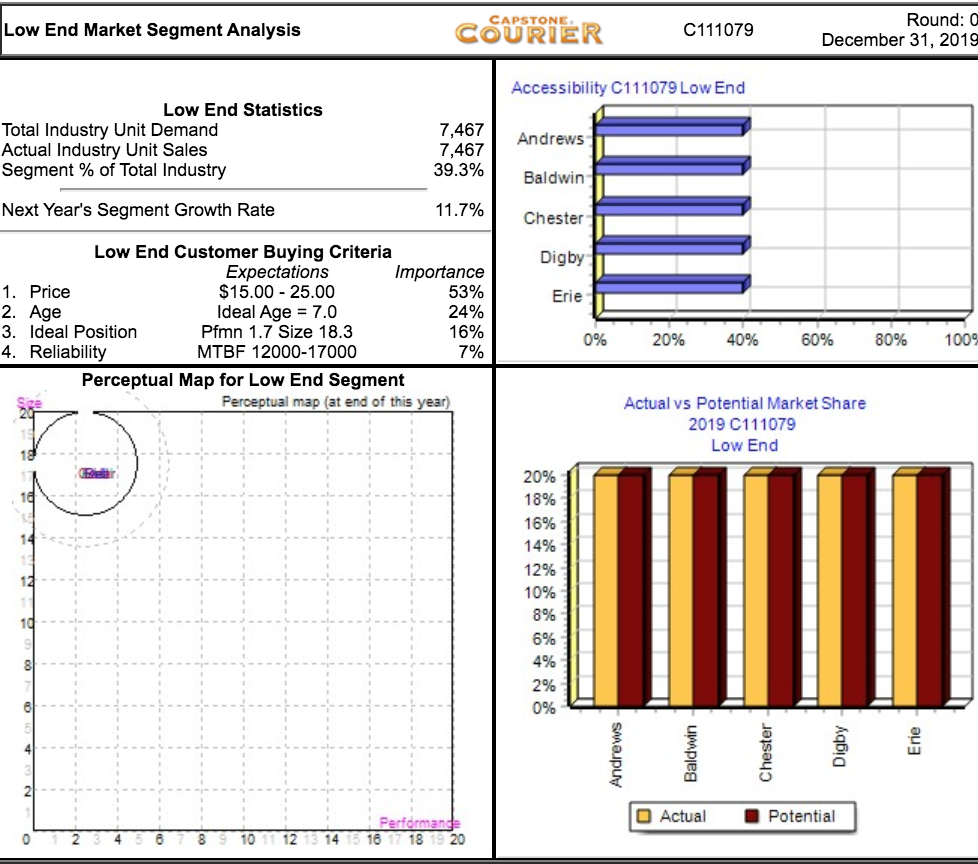
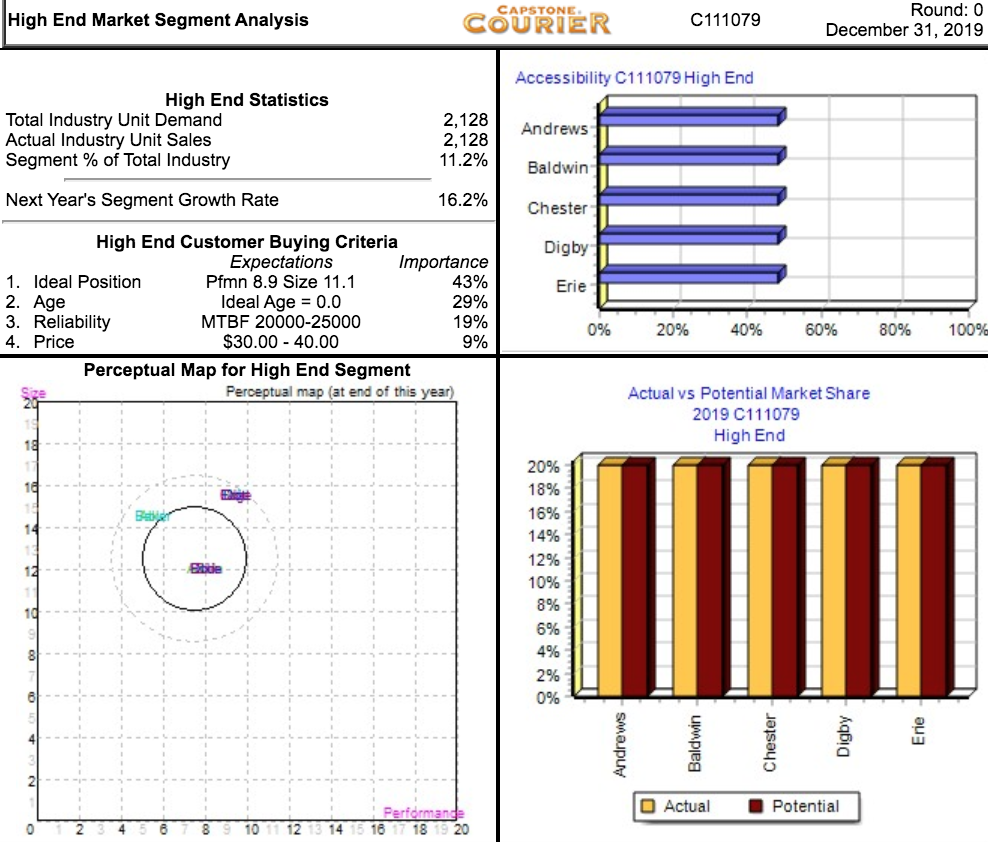
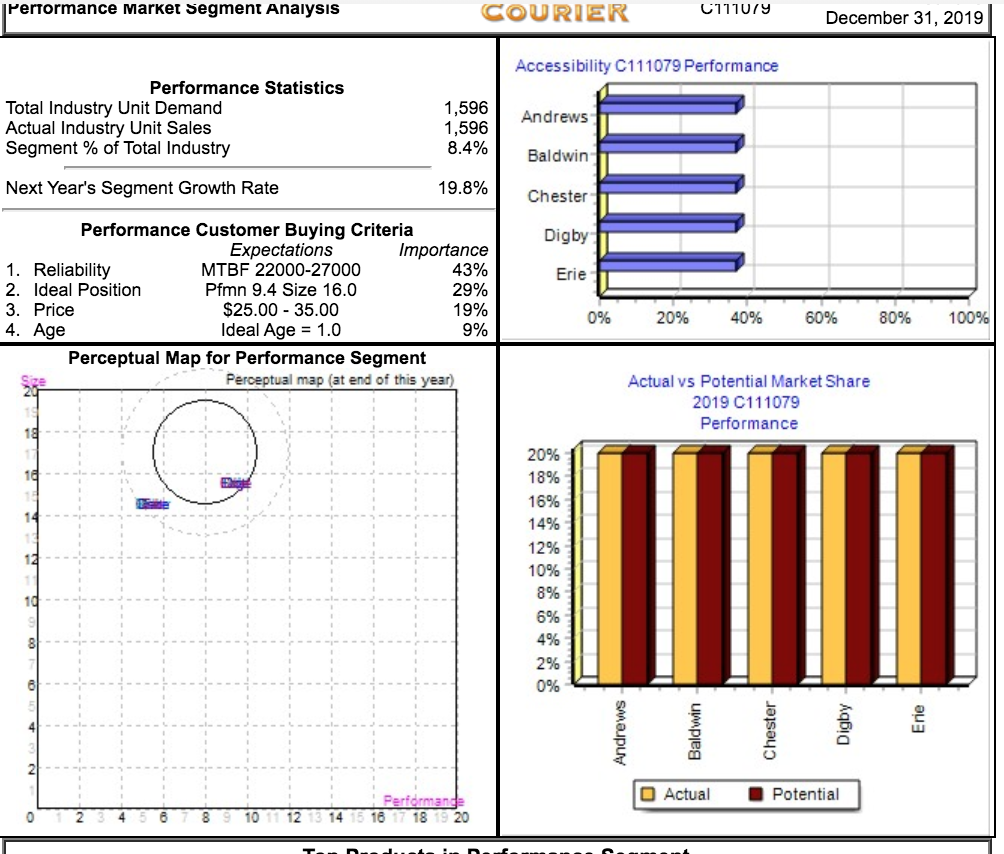
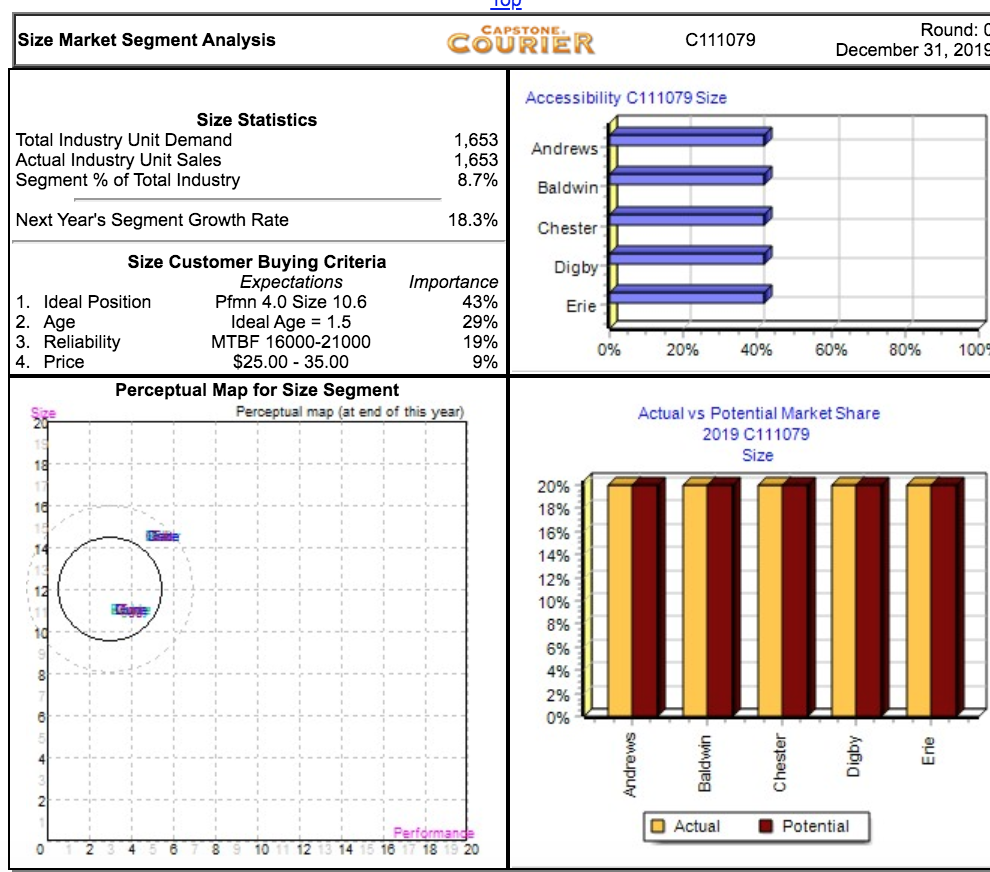
CAPSTONE Round: 0 COURIER Traditional Market Segment Analysis C111079 December 31, 2019 Accessibility C111079 Traditional Traditional Statistics 6,156 6,156 32.4% Total Industry Unit Demand Actual Industry Unit Sales Segment % of Total Industry Andrews Baldwin Next Year's Segment Growth Rate 9.2% Chester Traditional Customer Buying Criteria Expectations Ideal Age 2.0 $20.00 30.00 Digby Importance 47% 23% 1. Age 2. Price 3. Ideal Position 4. Reliability Erie Pfmn 5.0 Size 15.0 21% 0% 20% 40% 60% 80% 100% MTBF 14000-19000 9% Perceptual Map for Traditional Segment Perceptual map (at end of this year) Actual vs Potential Market Share 2019 C111079 Traditional 20% 18% 16% 14% 12% 10% 8% 6% 4% 2% 0% OActual Potential Perfdrmande 18 20 Round: C December 31, 201S CAPSTONE COURIER Low End Market Segment Analysis C111079 Accessibility C111079 Low End Low End Statistics Total Industry Unit Demand Actual Industry Unit Sales Segment % of Total Industry 7,467 7,467 39.3% Andrews Baldwin Next Year's Segment Growth Rate 11.7% Chester Low End Customer Buying Criteria Expectations $15.00 25.00 Ideal Age 7.0 Pfmn 1.7 Size 18.3 Digby Importance 53% 24% 16% 7% 1. Price Erie 2. Age 3. Ideal Position 100 0% 20% 40% 60% 80% 4. Reliability MTBF 12000-17000 Perceptual Map for Low End Segment Perceptual map (at end of this year) Actual vs Potential Market Share 2019 C111079 Low End 20% 18% 16% 14% 12% 10% 89% 6% 4% 2% 0% O Actual Potential Perfdrmande 16 18 14 Andrews Baldwin Chester Digby Round: 0 December 31, 2019 CAPSTONE. COURIER High End Market Segment Analysis C111079 Accessibility C111079 High End High End Statistics Total Industry Unit Demand Actual Industry Unit Sales Segment % of Total Industry 2,128 2,128 11.2% Andrews Baldwin 16.2% Next Year's Segment Growth Rate Chester High End Customer Buying Criteria Expectations Pfmn 8.9 Size 11.1 Ideal Age 0.0 MTBF 20000-25000 $30.00 40.00 Digby Importance 43% 1. Ideal Position Erie 2. Age 3. Reliability 4. Price 29% 19% 9% 0% 20% 40% 60% 80% 100% Perceptual Map for High End Segment Perceptual map (at end of this year) Actual vs Potential Market Share 2019 C111079 High End 20% 18% 16% 14% 12% 10% 8% 6% 4% 2% 0% O Actual Potential Performande 14 15 18 12 18 20 SAMaupuy |PerTormance Market Segment Analysis COURIER C111UY December 31, 2019 Accessibility C111079 Performance Performance Statistics 1,596 1,596 8.4% Total Industry Unit Demand Actual Industry Unit Sales Segment % of Total Industry Andrews Baldwin Next Year's Segment Growth Rate 19.8% Chester Performance Customer Buying Criteria Expectations MTBF 22000-27000 Digby Importance 43% 29% 19% 9% 1. Reliability 2. Ideal Position 3. Price Erie Pfmn 9.4 Size 16.0 $25.00 35.00 0% 20% 40% 60% 80% 100% Ideal Age 1.0 4. Age Perceptual Map for Performance Segment Perceptual map (at end of this year) Actual vs Potential Market Share 2019 C111079 Performance 20% 18% 16% 14% 12% 10% 8% 6% 4% 2% 0% OActual Potential Perfdrmande 18 19 20 12 13 14 15 16 10 CAPSTONE Round: 0 COURIER Traditional Market Segment Analysis C111079 December 31, 2019 Accessibility C111079 Traditional Traditional Statistics 6,156 6,156 32.4% Total Industry Unit Demand Actual Industry Unit Sales Segment % of Total Industry Andrews Baldwin Next Year's Segment Growth Rate 9.2% Chester Traditional Customer Buying Criteria Expectations Ideal Age 2.0 $20.00 30.00 Digby Importance 47% 23% 1. Age 2. Price 3. Ideal Position 4. Reliability Erie Pfmn 5.0 Size 15.0 21% 0% 20% 40% 60% 80% 100% MTBF 14000-19000 9% Perceptual Map for Traditional Segment Perceptual map (at end of this year) Actual vs Potential Market Share 2019 C111079 Traditional 20% 18% 16% 14% 12% 10% 8% 6% 4% 2% 0% OActual Potential Perfdrmande 18 20 Round: C December 31, 201S CAPSTONE COURIER Low End Market Segment Analysis C111079 Accessibility C111079 Low End Low End Statistics Total Industry Unit Demand Actual Industry Unit Sales Segment % of Total Industry 7,467 7,467 39.3% Andrews Baldwin Next Year's Segment Growth Rate 11.7% Chester Low End Customer Buying Criteria Expectations $15.00 25.00 Ideal Age 7.0 Pfmn 1.7 Size 18.3 Digby Importance 53% 24% 16% 7% 1. Price Erie 2. Age 3. Ideal Position 100 0% 20% 40% 60% 80% 4. Reliability MTBF 12000-17000 Perceptual Map for Low End Segment Perceptual map (at end of this year) Actual vs Potential Market Share 2019 C111079 Low End 20% 18% 16% 14% 12% 10% 89% 6% 4% 2% 0% O Actual Potential Perfdrmande 16 18 14 Andrews Baldwin Chester Digby Round: 0 December 31, 2019 CAPSTONE. COURIER High End Market Segment Analysis C111079 Accessibility C111079 High End High End Statistics Total Industry Unit Demand Actual Industry Unit Sales Segment % of Total Industry 2,128 2,128 11.2% Andrews Baldwin 16.2% Next Year's Segment Growth Rate Chester High End Customer Buying Criteria Expectations Pfmn 8.9 Size 11.1 Ideal Age 0.0 MTBF 20000-25000 $30.00 40.00 Digby Importance 43% 1. Ideal Position Erie 2. Age 3. Reliability 4. Price 29% 19% 9% 0% 20% 40% 60% 80% 100% Perceptual Map for High End Segment Perceptual map (at end of this year) Actual vs Potential Market Share 2019 C111079 High End 20% 18% 16% 14% 12% 10% 8% 6% 4% 2% 0% O Actual Potential Performande 14 15 18 12 18 20 SAMaupuy |PerTormance Market Segment Analysis COURIER C111UY December 31, 2019 Accessibility C111079 Performance Performance Statistics 1,596 1,596 8.4% Total Industry Unit Demand Actual Industry Unit Sales Segment % of Total Industry Andrews Baldwin Next Year's Segment Growth Rate 19.8% Chester Performance Customer Buying Criteria Expectations MTBF 22000-27000 Digby Importance 43% 29% 19% 9% 1. Reliability 2. Ideal Position 3. Price Erie Pfmn 9.4 Size 16.0 $25.00 35.00 0% 20% 40% 60% 80% 100% Ideal Age 1.0 4. Age Perceptual Map for Performance Segment Perceptual map (at end of this year) Actual vs Potential Market Share 2019 C111079 Performance 20% 18% 16% 14% 12% 10% 8% 6% 4% 2% 0% OActual Potential Perfdrmande 18 19 20 12 13 14 15 16 10
Step by Step Solution
There are 3 Steps involved in it

Get step-by-step solutions from verified subject matter experts