

Question: Instructions: Complete the problem below. Create a single script (.m file) to complete this assignment. Unless directed otherwise, use meaningful variable names for each variable;
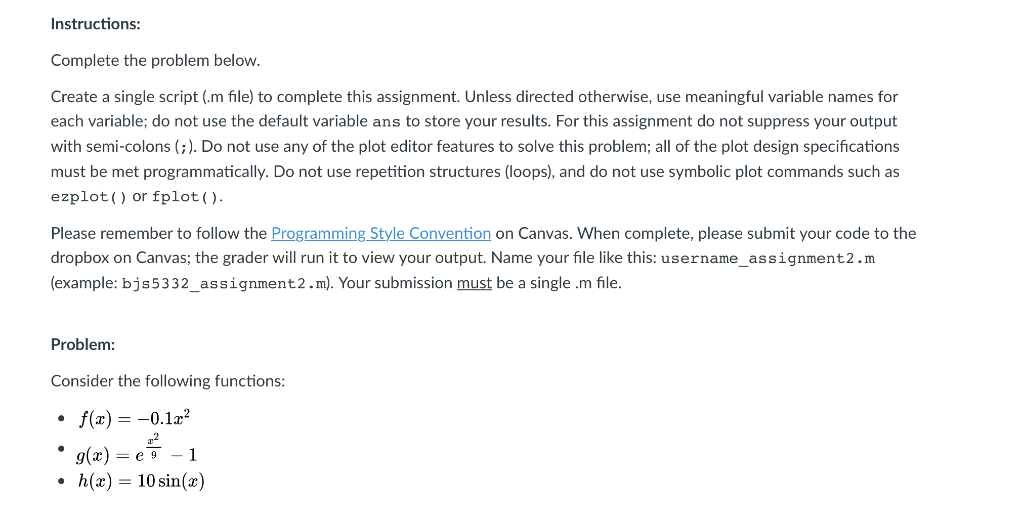
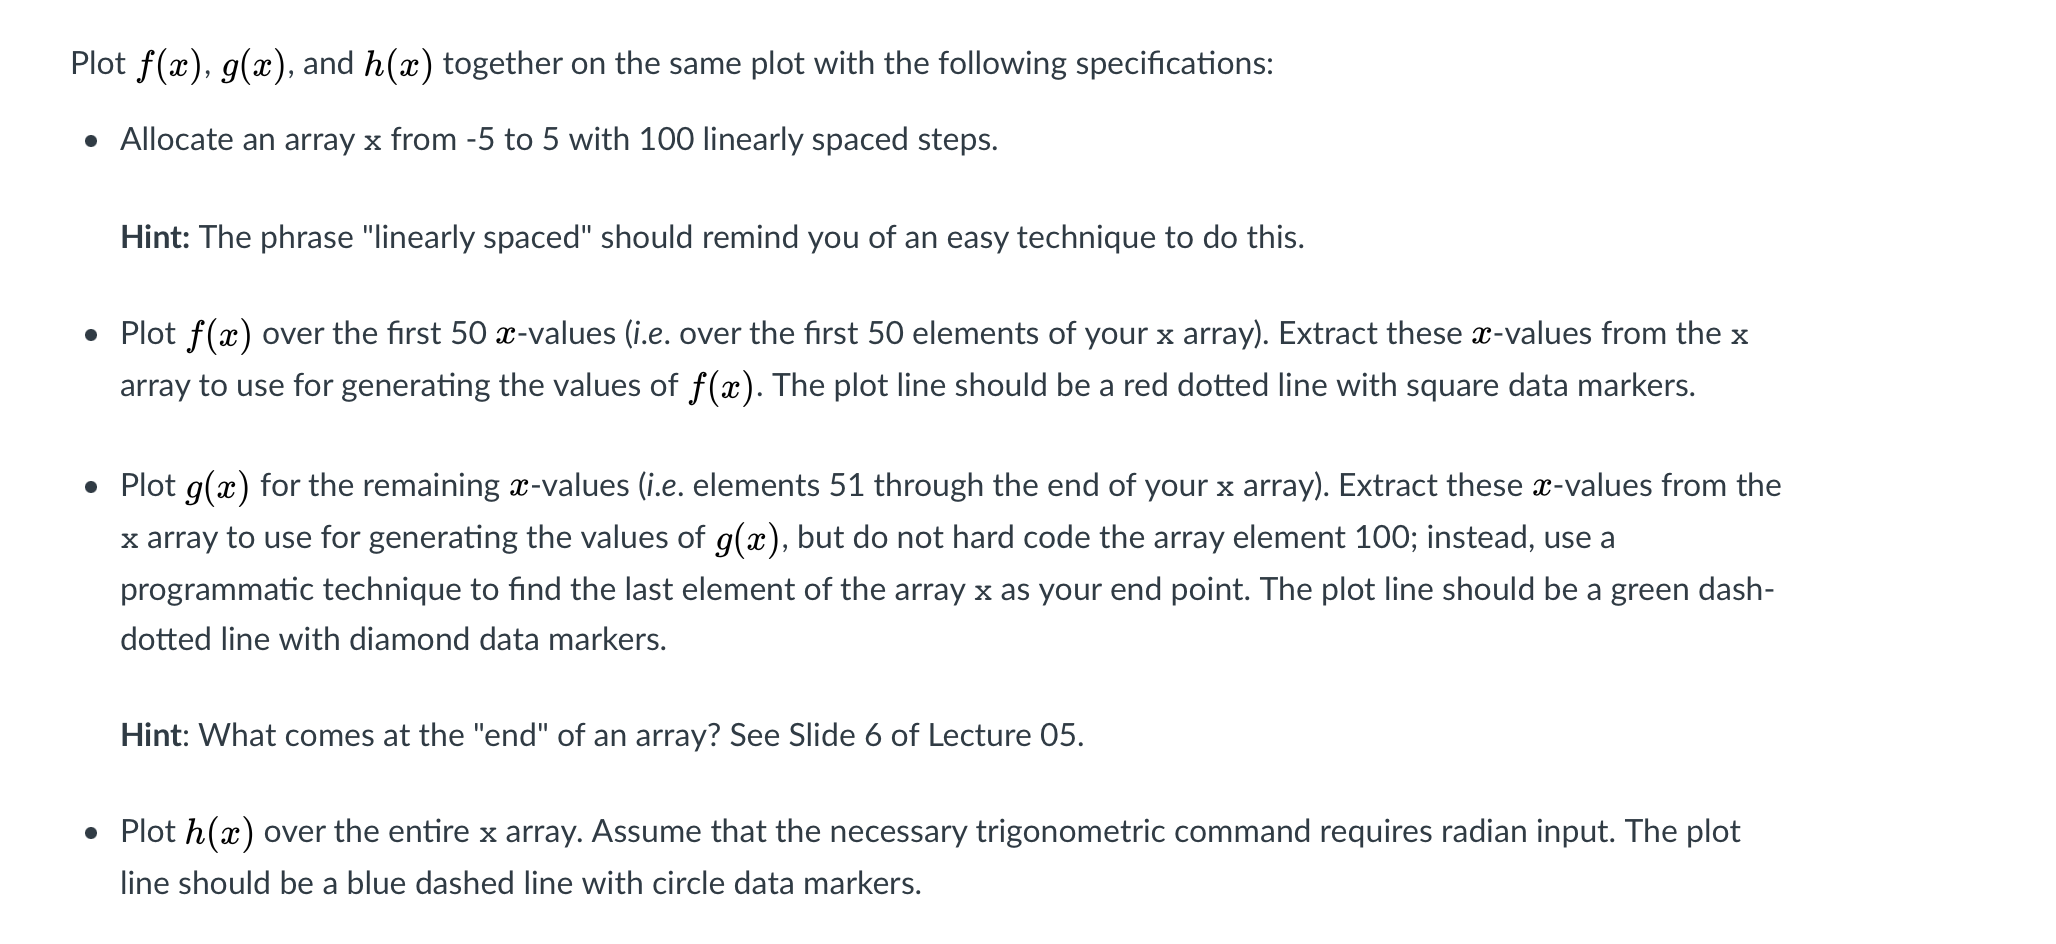
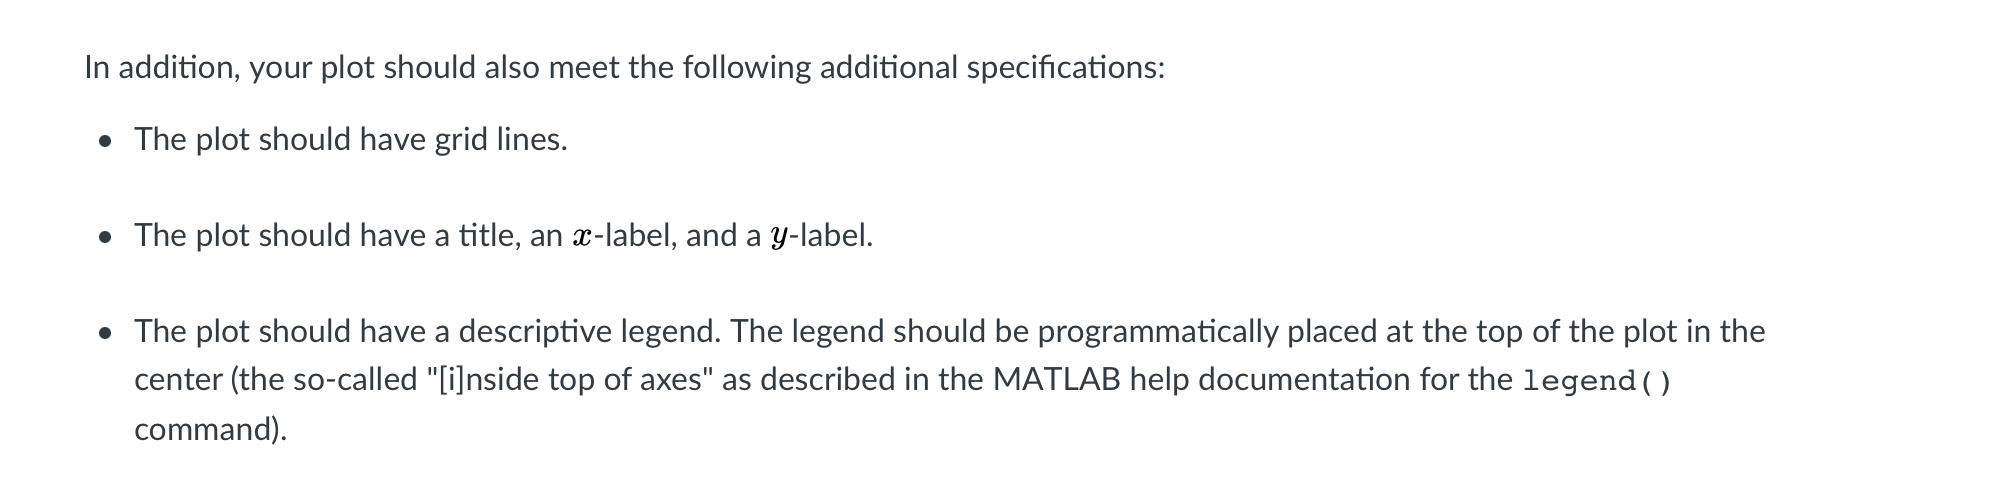
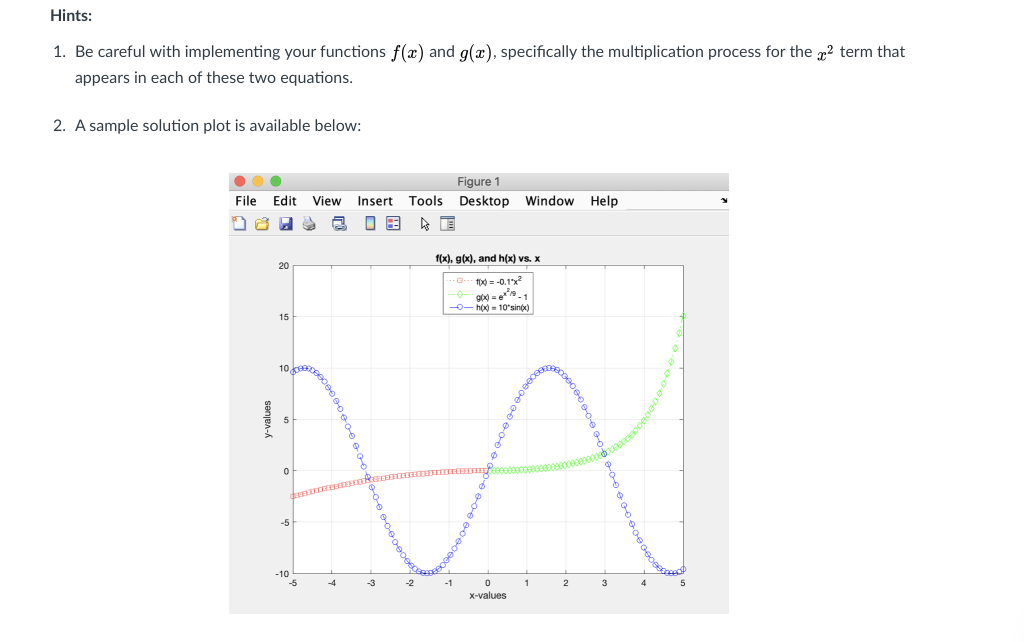
Instructions: Complete the problem below. Create a single script (.m file) to complete this assignment. Unless directed otherwise, use meaningful variable names for each variable; do not use the default variable ans to store your results. For this assignment do not suppress your output with semi-colons (;). Do not use any of the plot editor features to solve this problem; all of the plot design specifications must be met programmatically. Do not use repetition structures (loops), and do not use symbolic plot commands such as ezplot() or fplot(). Please remember to follow the Programming Style Convention on Canvas. When complete, please submit your code to the dropbox on Canvas; the grader will run it to view your output. Name your file like this: username_assignment2.m (example: bjs5332_assignment2.m). Your submission must be a single.m file. Problem: Consider the following functions: f(x) = -0.1.22 ..2 g(x) = 7 -1 h(x) = 10 sin(x) . Plot f(x), g(x), and h(x) together on the same plot with the following specifications: Allocate an array x from -5 to 5 with 100 linearly spaced steps. Hint: The phrase "linearly spaced" should remind you of an easy technique to do this. Plot f(x) over the first 50 x-values (i.e. over the first 50 elements of your x array). Extract these x-values from the x array to use for generating the values of f(x). The plot line should be a red dotted line with square data markers. Plot g(2) for the remaining x-values (i.e. elements 51 through the end of your x array). Extract these x-values from the x array to use for generating the values of g(x), but do not hard code the array element 100; instead, use a programmatic technique to find the last element of the array x as your end point. The plot line should be a green dash- dotted line with diamond data markers. Hint: What comes at the "end" of an array? See Slide 6 of Lecture 05. Plot h(a) over the entire x array. Assume that the necessary trigonometric command requires radian input. The plot line should be a blue dashed line with circle data markers. In addition, your plot should also meet the following additional specifications: The plot should have grid lines. The plot should have a title, an X-label, and a y-label. The plot should have a descriptive legend. The legend should be programmatically placed at the top of the plot in the center (the so-called "[i]nside top of axes" as described in the MATLAB help documentation for the legend ( ) command). Hints: 1. Be careful with implementing your functions f(x) and g(2), specifically the multiplication process for the c2 term that appears in each of these two equations. 2. A sample solution plot is available below: File Edit View Figure 1 Insert Tools Desktop Window Help 16 f(x), g(x), and h(x) vs. X 20 to = -0.19% 900) = -- hox) - 10'sin(x) 15 10.DE y-values 0 -5 200ece -10 -5 -4 -3 -1 1. 2 3 4 5 0 x-values
Step by Step Solution
There are 3 Steps involved in it

Get step-by-step solutions from verified subject matter experts