

Question: Instructions: Using the tables below, calculate Materiality and Tolerable Misstatement/Performance Materiality (PM) for each scenario using a layered materiality calculation approach. Remember to determine the
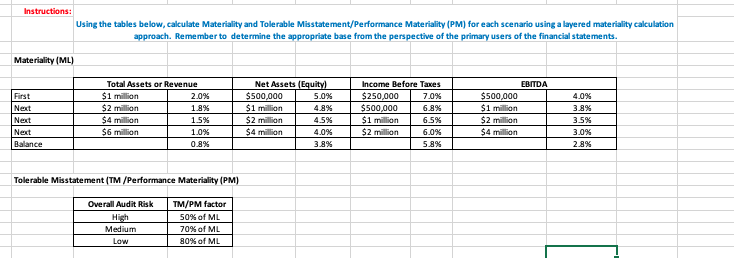
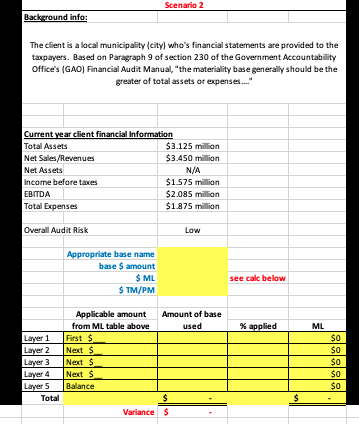
Instructions: Using the tables below, calculate Materiality and Tolerable Misstatement/Performance Materiality (PM) for each scenario using a layered materiality calculation approach. Remember to determine the appropriate base from the perspective of the primary users of the financial statements. Materiality ML) First Next EBITDA $500,000 $1 million Total Assets or Revenue $1 million 2.0% $2 million 1.8% $4 million $6 million 1.0% 0.8% Net Assets (Equity) $500.000 5.0% $1 million 4.8% $2 million 4.5% $ 4 million 4.0% 3.8% Income Before Taxes $250.000 7.0% $500,000 6.8% $1 million 6.5% $2 million 6.0% 5.8% 4.096 3.8% Next 3.5% $2 million $4 million 3.0% Next Balance 2.8% Tolerable Misstatement (TM/Performance Materiality (PM) Overall Audit Risk High Medium Low TM/PM factor 50% of ML 70% of ML 30% of ML Scenario 2 Background info: The client is a local municipality (city) who's financial statements are provided to the taxpayers. Based on Paragraph 9 of section 230 of the Government Accountability Office's (GAD) Financial Audit Manual, the materiality base generally should be the greater of total assets or expenses." Current year client financial Information Total Assets $3.125 million Net Sales Revenues $3.450 million Net Assets N/A Income before taxes $1575 million EBITDA $2.085 million Total Expenses $1875 million Overall Audit Risk Low Appropriate base name base $ amount see calc below $ TM/PM Amount of base % applied ML Applicable amount from ML table above First $ Next $ $0 Layer 4 Next $ Balance Instructions: Using the tables below, calculate Materiality and Tolerable Misstatement/Performance Materiality (PM) for each scenario using a layered materiality calculation approach. Remember to determine the appropriate base from the perspective of the primary users of the financial statements. Materiality ML) First Next EBITDA $500,000 $1 million Total Assets or Revenue $1 million 2.0% $2 million 1.8% $4 million $6 million 1.0% 0.8% Net Assets (Equity) $500.000 5.0% $1 million 4.8% $2 million 4.5% $ 4 million 4.0% 3.8% Income Before Taxes $250.000 7.0% $500,000 6.8% $1 million 6.5% $2 million 6.0% 5.8% 4.096 3.8% Next 3.5% $2 million $4 million 3.0% Next Balance 2.8% Tolerable Misstatement (TM/Performance Materiality (PM) Overall Audit Risk High Medium Low TM/PM factor 50% of ML 70% of ML 30% of ML Scenario 2 Background info: The client is a local municipality (city) who's financial statements are provided to the taxpayers. Based on Paragraph 9 of section 230 of the Government Accountability Office's (GAD) Financial Audit Manual, the materiality base generally should be the greater of total assets or expenses." Current year client financial Information Total Assets $3.125 million Net Sales Revenues $3.450 million Net Assets N/A Income before taxes $1575 million EBITDA $2.085 million Total Expenses $1875 million Overall Audit Risk Low Appropriate base name base $ amount see calc below $ TM/PM Amount of base % applied ML Applicable amount from ML table above First $ Next $ $0 Layer 4 Next $ Balance
Step by Step Solution
There are 3 Steps involved in it

Get step-by-step solutions from verified subject matter experts