

Question: Interpret this graph using theory background: Why price is declining since 2021? Interpret this graph using theory background: Why price is declining since 2021? Apple
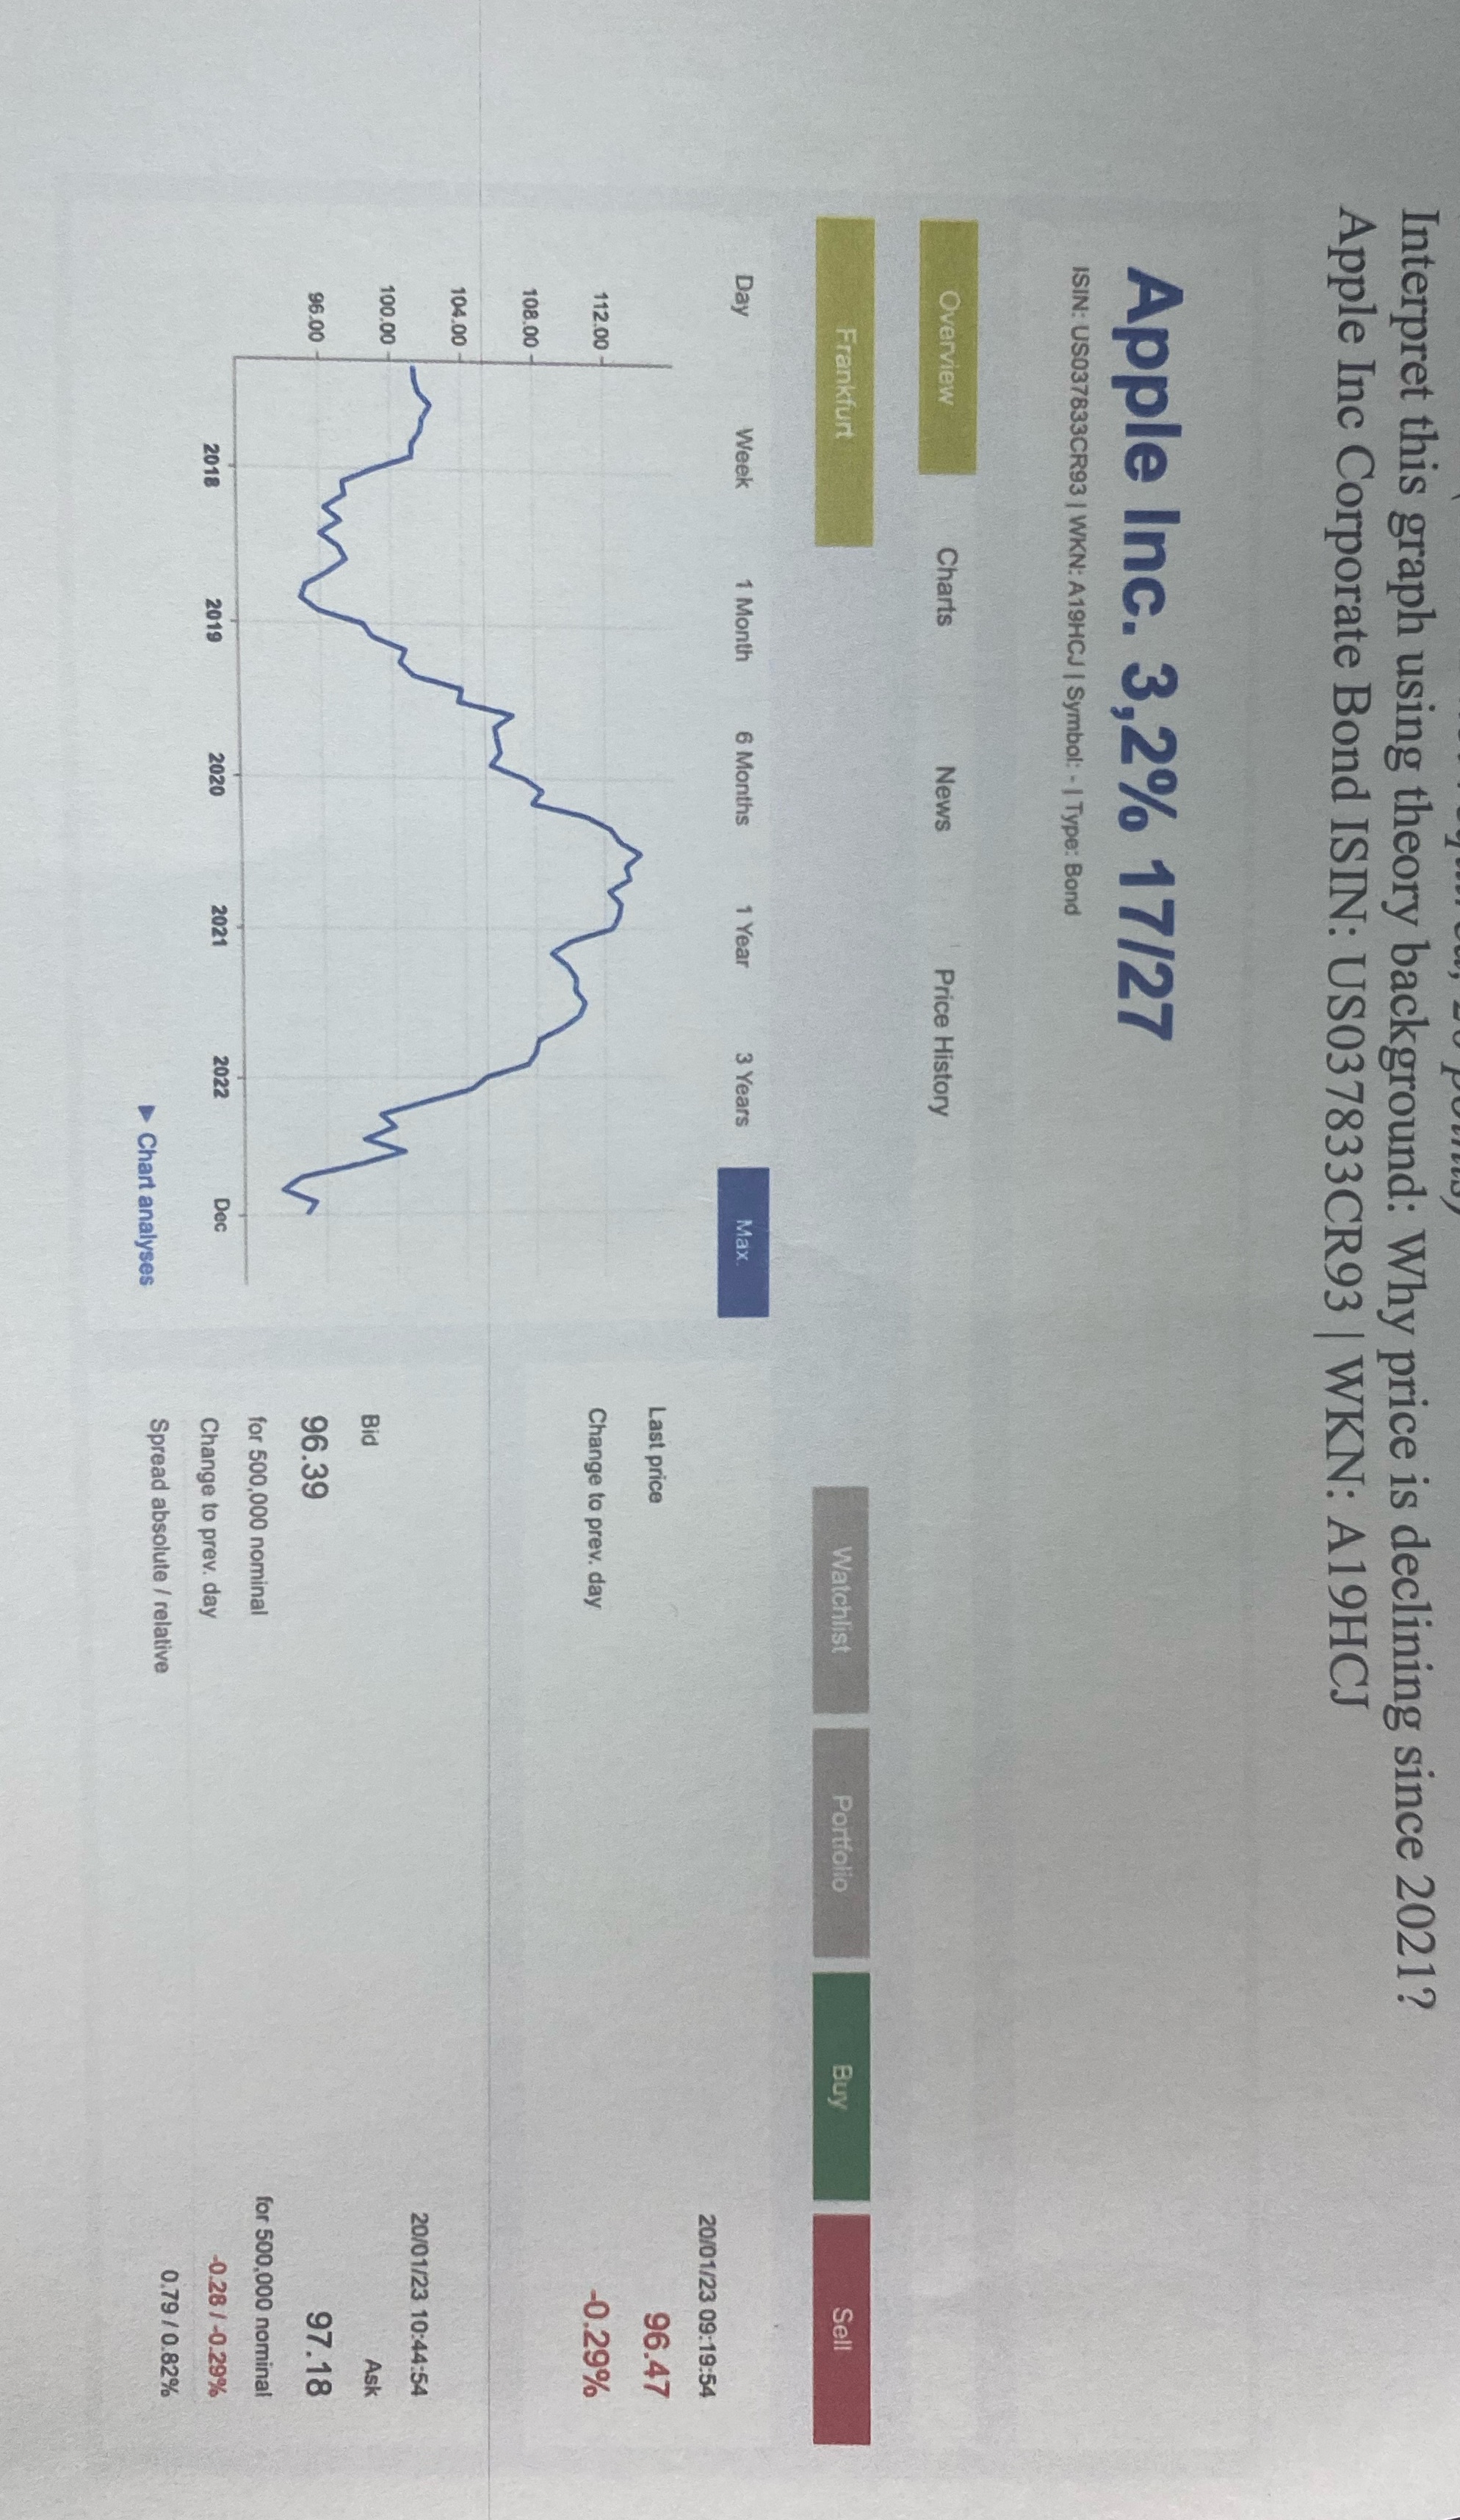
Interpret this graph using theory background: Why price is declining since 2021?
Step by Step Solution
There are 3 Steps involved in it
1 Expert Approved Answer
Step: 1 Unlock

Question Has Been Solved by an Expert!
Get step-by-step solutions from verified subject matter experts
Step: 2 Unlock
Step: 3 Unlock